-
GeneralGeneral
-
Biostatistics Homepage


This introductory course in Biostatistics provides foundational skills and knowledge in biostatistics and students will gain a deeper understanding of its relevance and application to public health, health policy, clinical medicine, and health economics. All parts of this training are free, including registration, learning, testing, and a certificate of completion. The course in Biostatistics is intended for students of public health, clinical medicine, biology, and other health sciences.
This course is co-sponsored by the University of the Incarnate Word, the Association for Prevention Teaching and Research (APTR), and the US Centers for Disease Control and Prevention (CDC). Like all NextGenU.org courses, it is competency-based, using competencies from the Association of Schools and Programs of Public Health (ASPPH). This course uses learning resources from world-class academic and governmental organizations such as Penn State University, Rice University, and the US Centers for Disease Control and Prevention (CDC).

For a publication on this course’s efficacy, see “Building Public Health Capacity through Online Global Learning,” (2018), Open Praxis, to see more research related to NextGenU.org’s educational model, check out NextGenU.org’s publication page. Subscribe to our newsletter to be notified of future updates, new courses, and to be part of our community.
There are two components to this course. The first component involves completing the modules and which provide:
- An introduction to probability and sampling distributions;
- An overview of confidence intervals, hypothesis testing, regression analysis, confounding, and interactions;
- Skills for the application of biostatistics in the practice and study of public health.
In order to receive a certificate of completion, you will need to also complete the second, skills-based component of the course, which requires you to identify a mentor with professional health care training at least at the bachelor’s level, and with a certificate or other specific training in Public Health, who can provide you with feedback on the assignments you submit.
The results of your assessments will be provided to you, and we can report your testing information and share your work with anyone you request (school, employer, etc.). The evaluation you provide at the course’s conclusion will help us improve the training for future students. We hope you find this Biostatistics course a wonderful learning experience!
Approximate time for the required readings in this course is 49 hours at an average reading rate of 144 words/minute; in addition, there are required activities as described above.
Before you begin the course, please take a moment to take the short knowledge Pre-course test below. It allows us to assess various aspects of the course itself and is mandatory to receive your certificate upon completion of the course. Then you may start Module 1: The Basics of Biostatistics.
The course requires completion of peer and mentored activities. At the end of each lesson, there is a practice quiz. At the end of the course, after you’ve completed each lesson, quiz, and activity, you’ll have access to a final exam, and a chance to assess the training. Once you’ve passed that last test, you will be able to download a certificate of completion from NextGenU.org and our course’s co-sponsoring organizations (listed above). We keep all of your personal information confidential, never sell any of your information, and only use anonymized data for research purposes, and we are also happy to report your testing information and share your work with anyone (your school, employer, etc.) at your request. We hope that you will find this a rewarding learning experience, and we count on your assessment and feedback to help us improve this training for future students.
Before you begin the course, please take a moment to take the short knowledge Pre-test below. It allows us to assess various aspects of the course itself and is required to receive your certificate upon completion of the course.
Engaging with this Course:
You may browse this course for free to learn for your personal enrichment; there are no requirements.
To obtain a certificate
- Show in the registration fields that you have the appropriate prerequisites to be certified [a high school degree for college courses, a college degree for the master’s level courses, and enrollment in or graduation from a medical doctoral program for our medical doctoral-level courses].
- Take the brief pre-test.
- Complete all the reading requirements.
- Complete all quizzes.
- Complete all 6 peer activity and associated certification quizzes.
- Find a mentor and complete the 3 required mentor activities.
- Successfully complete the final exam with a minimum of 70% and a maximum of 3 attempts.
- Complete the self and course evaluation forms.
To obtain credit
- Complete all requirements listed above for the certificate.
- Your learning institution or workplace should approve the partner-university-sponsored NextGenU.org course for educational credit, as they would for their learner taking a course anywhere.
- NextGenU.org is happy to provide your institution with:
- a link to and description of the course training, so they can see all its components, including the cosponsoring universities and other professional organization cosponsors;
- your grade on the final exam;
- your work products (e.g. peer and mentored activities), and any other required or optional shared materials that you produce and authorize to share with them;
- your evaluations -- course, self, and peer assessments;
- a copy of your certificate of completion, with the co-sponsoring universities and other organizations listed.
We hope that you will find this a rewarding learning experience, and we count on your assessment and feedback to help us improve this training for future students.
Next Steps
- Take the short knowledge pre-test below. It allows us to assess various aspects of the course itself.
- Complete the registration form.
- Begin the course with Module 1: The Basics of Biostatistics. In each lesson, read the description, complete all required readings and any required activity, and take the corresponding quizzes.
-
Module 1: The Basics of Biostatistics
Before starting this first module, please take a moment to take the short knowledge Pre-test above. It allows us to assess various aspects of the course itself and is mandatory to receive your certificate upon completion of the course.
Competencies covered in this module:

- Describe the roles biostatistics serves in the discipline of public health.
- Distinguish among the different measurement scales and the implications for selection of statistical methods to be used based on these distinctions.
- Apply descriptive techniques commonly used to summarize public health data.
- Apply descriptive and inferential methodologies according to the type of study design for answering a particular research question.
-
Module 1: Lesson 1: Introduction to Biostatistics
Learning Objectives
- Explore the basic principles of statistics and some of its common uses.
- Understand the basic principles of probability, descriptive statistics, and data analysis.
- Understand how to generate descriptive statistics from data.
4 URLs -
Module 1: Lesson 2: Types of Variables, Plots, and Graphs
Learning Objectives
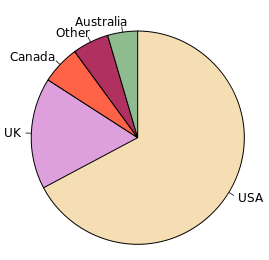
- Understand the different types of variables, how they are used, and how to summarize the data.
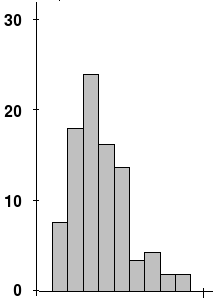
- Understand and identify the different types of plots and graphs.
5 URLs, 1 Quiz -
Module 1: Lesson 3: Descriptive Statistics and Distribution
Learning Objectives
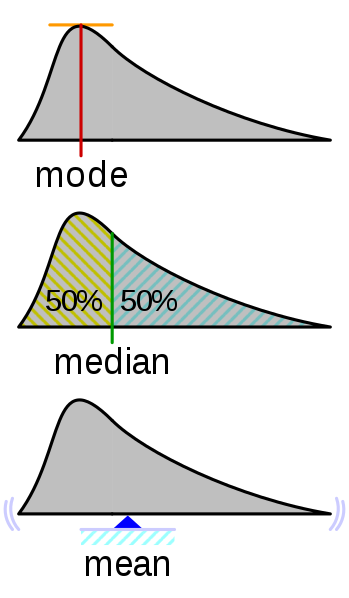
- Generate descriptive statistics from data, calculate descriptive statistics and standard deviations, and understand the methods of summarizing a single quantitative variable.
- Summarize and describe the distribution of a categorical variable, and understand the uses and implications of the normal distribution.
Click here to start this lesson5 URLs, 1 Quiz -
Module 1: Lesson 4: Data Analysis and Study Design
Learning Objectives
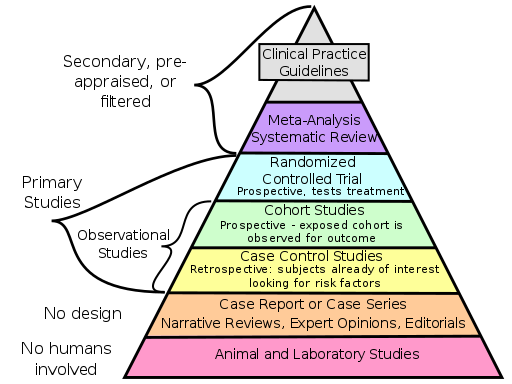
- Understand the basic types of data, the main ways in which data are used, and important considerations when using data in analysis.
- Identify the design of a study and explain how this impacts interpretation.
- Apply knowledge and skills in working with different data types in a chosen public health setting.
4 URLs, 1 Workshop, 1 Assignment, 1 Quiz -
Module 2: Probability and Sampling Distributions
Competencies covered in this module:

- Describe basic concepts of probability, random variation, and commonly used statistical probability distributions.
- Distinguish among the different measurement scales and the implications for selection of statistical methods to be used based on these distinctions.
- Apply descriptive techniques commonly used to summarize public health data.
- Apply common statistical methods for inference.
- Apply descriptive and inferential methodologies according to the type of study design for answering a particular research question.
-
Module 2: Lesson 1: Probability, Frequency, and the Concepts of Probability
Learning Objectives
- Relate the probability of an event to the likelihood of this event occurring.
- Understand how to interpret and generate proportions from data.
- Explain how relative frequency can be used to estimate the probability of an event.
- Understand the concepts of probability, conditional probability, and independence.
6 URLs, 1 Quiz -
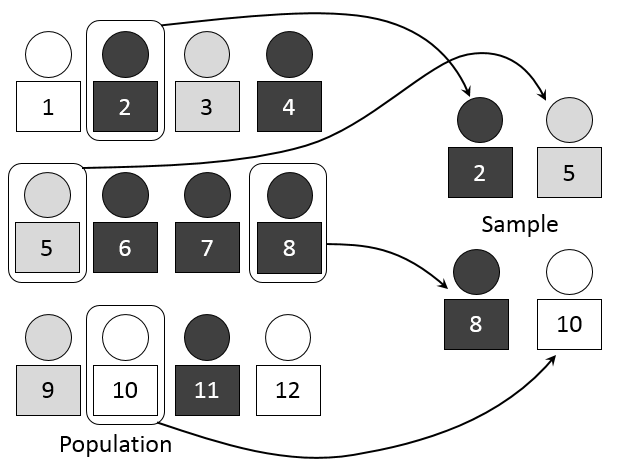
Module 2: Lesson 2: Variables, Sampling, and Distribution
Learning Objectives
- Understand the concept of random variables.
- Distinguish between samples and population and identify different types of samples.
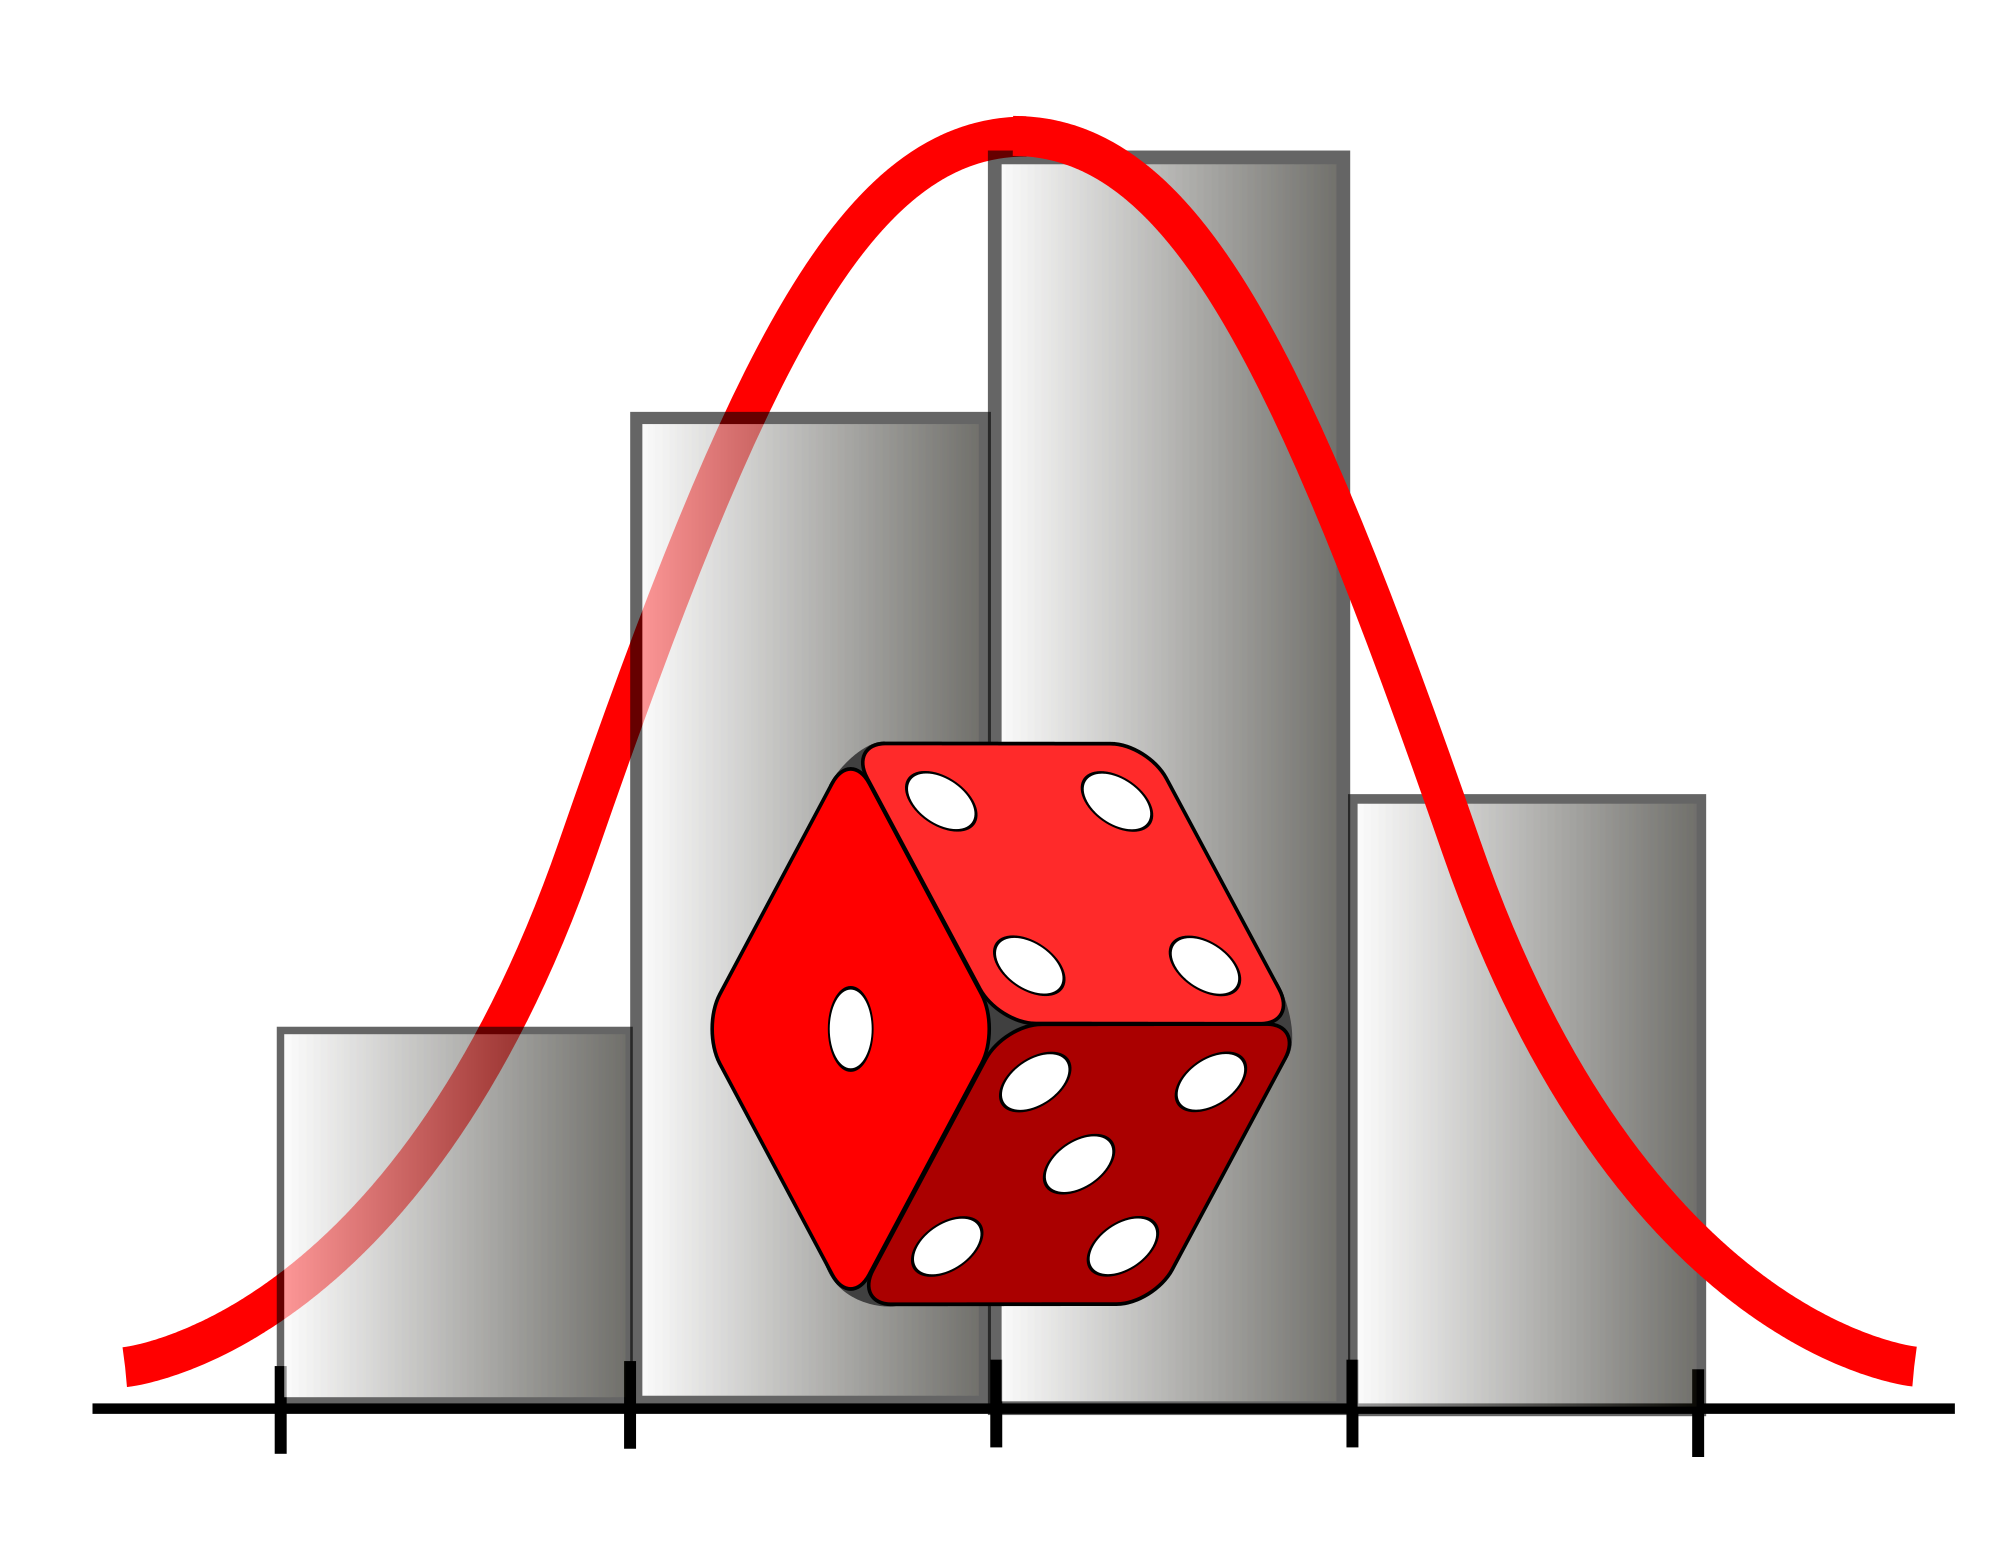
- Understand sampling distribution, variance, and the central limit theorem.
- Understand the implications and uses of normality and skewness.
- Be able to calculate and correctly interpret probability data from a sampling distribution.
10 URLs, 1 Workshop, 1 Quiz -
Module 3: Confidence Intervals
Competencies covered in this module

- Distinguish among the different measurement scales and the implications for selection of statistical methods to be used based on these distinctions.
- Apply common statistical methods for inference.
- Apply descriptive and inferential methodologies according to the type of study design for answering a particular research question.
-
Module 3: Lesson 1: Point and Confidence Interval Estimation
Learning Objectives
- Understand and be able to apply point estimation and confidence interval estimation.
- Recognize inference on means versus inference on proportion.
- Be able to calculate one-sided and two-sided confidence intervals for mean and proportion.
6 URLs, 1 Quiz -
Module 3: Lesson 2: Effect of Sample Size on Confidence Interval
Learning Objectives

- Understand the effect of sample size and other conditions on estimation as well as understand and be able to calculate the sample size needed to achieve the desired confidence level.
2 URLs, 1 Quiz -
Module 4: Hypothesis Testing
Competencies covered in this module:

- Describe preferred methodological alternatives to commonly used statistical methods when assumptions are not met.
- Apply common statistical methods for inference.
- Apply descriptive and inferential methodologies according to the type of study design for answering a particular research question.
-
Module 4: Lesson 1: Principles of Hypothesis Testing
Learning Objectives
- Reinforce understanding of probability distributions in the context of hypothesis testing, especially in drawing conclusions and types of errors.
- Distinguish types of explanatory and response variables.
- Understand the relationship between confidence interval and hypothesis testing.
7 URLs, 1 Quiz -
Module 4: Lesson 2: Applications of Hypothesis Testing
Learning Objectives

- Understand and apply hypothesis tests for a single mean and a single proportion as well as for two means (independent and paired/matched samples), and understand chi-squared test and ANOVA.
- Understand inference, estimation, and the basics of hypothesis testing.
- Understand implications of multiple testing and Bonferroni correction.
- Understand and be able to correctly interpret p-values.
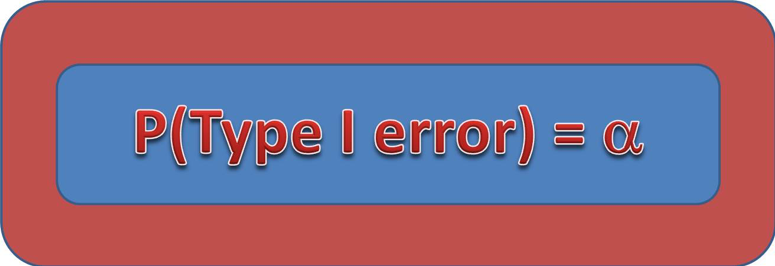
- Understand the importance and implications of Type I and Type II errors.
11 URLs, 1 Quiz -
Module 4: Lesson 3: Power and Sample Size
Learning Objective
- Understand factors that affect study power and sample size requirements, and how they impact study design.
5 URLs, 1 Quiz -
Module 4: Lesson 4: Nonparametric Tests
Learning Objectives
- Summarize and describe non-parametric tests and understand the conditions under which they are applied.
- Be able (1) to apply appropriate hypothesis tests to variable types in order to explore relationships and (2) to draw conclusions based on such hypothesis testing and to interpret p-values.
5 URLs, 1 Quiz, 4 Forums -
Module 5: Regression Analysis
Competencies covered in this module:

- Apply common statistical methods for inference.
- Apply descriptive and inferential methodologies according to the type of study design for answering a particular research question.
-
Module 5: Lesson 1: Simple Linear Regression Analysis
Learning Objectives
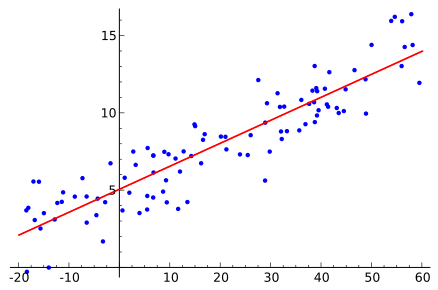
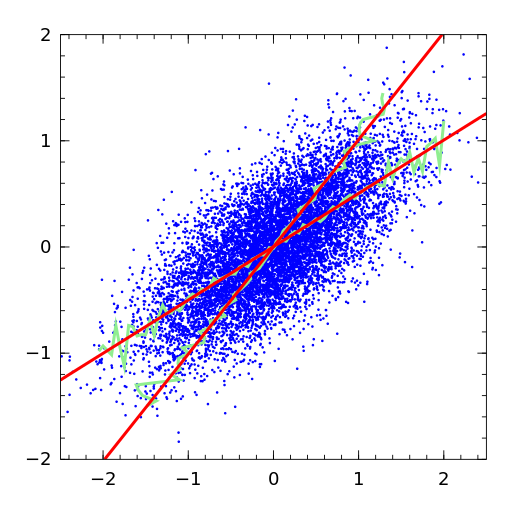
- Understand linear relationships, outliers, and the basics of correlation.
- Understand the difference between correlation and simple linear regression, and when to apply one or the other.
- Understand homoscedasticity and its applications to correlation and regression.
- Understand linear regression and how it relates to prediction.
10 URLs, 1 Quiz -
Module 5: Lesson 2: Multiple Linear Regression Analysis
Learning Objective
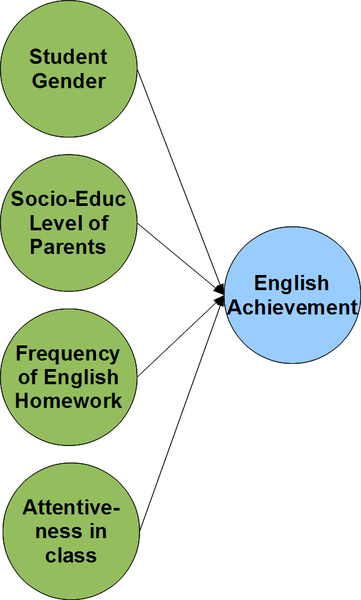
- Understand multiple linear regression and its applications.
2 URLs, 1 Quiz -
Module 5: Lesson 3: Logistic Regression Analysis
Learning Objectives
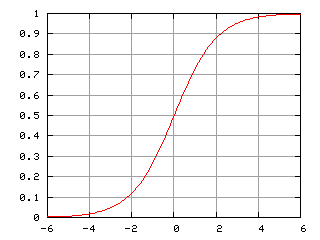
- Understand simple logistic regression analysis.
- Understand multiple logistic regression analysis and distinguish between adjusted and unadjusted regression coefficients.
- Be able (1) to distinguish between risks, e.g., absolute and relative risks, as well as odds and odds ratios, and (2) to differentiate relative risks from odds ratios and know how to conduct both methods.
8 URLs, 1 Quiz -
Module 5: Lesson 4: Overview of Correlation and Regression Analysis
Learning Objectives
- Be able (1) to distinguish between correlation, linear and multiple regression, and logistic regression, and (2) to understand the purpose and methods of linear (simple and multiple) and logistic regression, including when to use each of them.
- Be able to specify regression models and interpret regression results.
2 URLs, 2 Peer Activities, 1 Quiz -
Module 6: Confounding and Interactions
Competency covered in this module:

- Describe the roles biostatistics serves in the discipline of public health.
- Apply common statistical methods for inference.
-
Module 6: Lesson 1: Confounding and Effect Modification
Learning Objectives
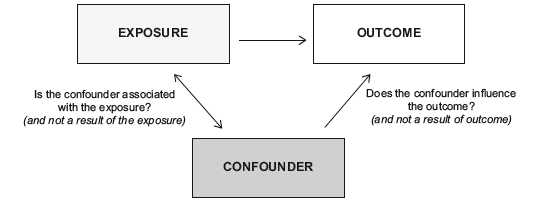
- Know the definition of a confounder and understand the concepts of adjustment and stratification, as well as the concepts of confounding and effect modification.
- Identify the statistical techniques for dealing with confounding and effect modification and their strengths and limitations.
7 URLs, 1 Quiz -
Module 6: Lesson 2: Confounders and their Impact on Study Conclusions
Learning Objectives
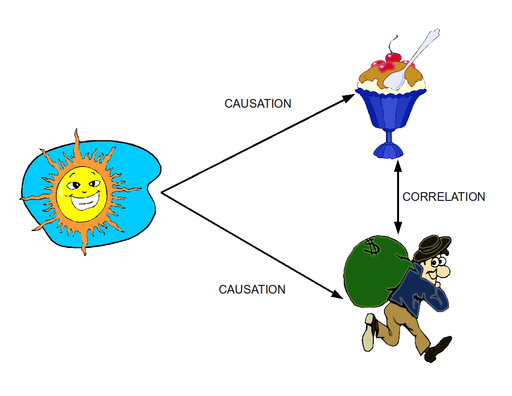
- Be able to comment on the validity of study conclusions with respect to confounding and alternative explanations and appreciate that association neither means causation nor indicates the directionality of potential cause and effect.
- Identify potential confounders in a relationship from a theoretical perspective and understand the consequences of using faulty reasoning and improper methods in studies.
- Apply analytical statistics in the context of a research project and be able to think critically about practical application of statistical concepts.
2 URLs, 1 Assignment, 1 Quiz -
Module 7: Biostatistics in Public Health

Competency covered in this module:
- Describe the roles biostatistics serves in the discipline of public health.
- Apply descriptive and inferential methodologies according to the type of study design for answering a particular research question.
- Apply basic informatics techniques with vital statistics and public health records in the description of public health characteristics and in public health research and evaluation.
- Interpret results of statistical analyses found in public health studies.
- Develop written and oral presentations based on statistical analyses for both public health professionals and educated lay audiences.
-
Module 7: Lesson 1: Limitations and Misinterpretations of Biostatistics
Learning Objectives

- Understand and explain the relative strengths and limitations of biostatistics as it applies in various settings in public health.
- Be able to detect misleading claims and inappropriate methods in research papers as well as appreciate that a statistically significant result may not be clinically significant.
- Appreciate that many interests may influence researchers towards favorable interpretation and presentation of their findings.
4 URLs, 1 Quiz -
Module 7: Lesson 2: Biostatistics in Public Health Programs
Learning Objectives
- Understand that public health programs rely on biostatistics principles and methodologies to collect, analyze use, and present data.
- Relate specific public health contributions to biostatistics concepts learned in this course.
8 URLs, 1 Workshop, 1 Assignment, 1 Quiz, 1 SCORM package -
Course and Self Evaluation & Certificate
 In this section, you can provide feedback about this course to help us make NextGenU.org better. Once evaluations are completed, you will be able to download your certificate of completion.


 Click here to start Final Examination