-
GeneralGeneral
-
Homepage


Welcome to Intro to Statistics, the second course in the Mathematics series for the Health Sciences Training Certificate. This course and the Certificate are designed primarily for learners interested in preparing for and gaining entry to health-related programs and to help address the prerequisites for the Medical College Admission Test (MCAT). This Intro to Statistics course provides in-depth learning about general mathematical concepts and techniques in the natural, physical, behavioral, and social sciences bachelor study. Participants can review and gain mathematical knowledge on analyzing and manipulating scientific data. The course explores important areas of mathematics such as statistics, graphic and numerical methods of describing data, probability, distributions, estimation, testing hypotheses, and regression analysis that can be applied to scientific inquiry.
The International Development Research Centre and the University of the Incarnate Word School of Osteopathic Medicine partly sponsor the Intro to Statistics course. Like all NextGenU.org courses, it is competency-based, using competencies based on the Association of American Medical Colleges' Medical College Admission Test. It uses learning resources from accredited, academic, professional, and world-class organizations and universities such as Rice University. Volunteer designers for this course include Shaunik Sharma, BSc; Tristan Aaron Wild, BMSc (Hons); and the late Mohammad Asadi-Lari, a former MD-PHD Candidate at the University of Toronto. The course was created by Marco Aurelio Hernandez, Ph. D., Alexandria Ali, BSc, and Pablo Baldiviezo, MD. MSc. DiplEd.
For publications on the efficacy of NextGenU.org's courses, see NextGenU.org's publication page.
There are eight modules to complete, which provide an introduction to:
- Module 1: Introduction to Statistics and Research in Health Care.
- Module 2: Graphical Methods of Describing Data.
- Module 3: Numerical Methods of Describing Data: Summary Numbers.
- Module 4: Probability, Random Variables, and Distributions.
- Module 5: Sampling Distributions.
- Module 6: Estimation.
- Module 7: Testing of Hypotheses.
- Module 8: Introduction to Linear Regression Analysis.
The completion time for this course is estimated at 92 hours, 24 comprising hours of learning resources, 48 hours of studying and assimilation of the content, and 20 hours of participating in learning activities and quizzes to assist the learners in synthesizing learning materials. This course is equivalent to 3 credit hours in the U.S. undergraduate/bachelor's degree system.The course requires the completion of all quizzes, discussion forums, and practical activities to receive a course certificate.
Practice quizzes, composed of multiple-choice questions, are available throughout the courses. After you've completed each module, quiz, and learning activity, at the end of the course, you'll have access to a final exam consisting of 25 multiple-choice questions, a last lab activity, and a chance to evaluate this course.
Participants have up to three opportunities to take the final exam and achieve the required passing score of >=70%. Once you've passed the final exam and completed the evaluations, you can download a certificate of completion from NextGenU.org and our course's co-sponsoring organizations.
We keep your personal information confidential, never sell any of your information, and only use anonymized data for research purposes. Also, we are happy to report your testing information and share your work with anyone (your school, employer, etc.) at your request.
Engaging with this Course:
This free course is aimed at students who have graduated from high school and want to prepare to become a health professional and pass the MCAT exam. You can also browse this course for personal enrichment if you don't have any requirements.
To obtain a certificate, a learner must first register for the course and then complete:
- Pre-test
- All the reading requirements,
- All quizzes and pass with 80% with unlimited attempts,
- All practical activities,
- All discussion forums,
- The final lab activity,
- The final exam with a minimum of 80% and a maximum of 3 attempts, and
- The self and course evaluation forms.
To obtain credit:- Complete all requirements listed above for the Certificate, and
- Your learning institution or workplace should approve the partner-university-sponsored NextGenU.org course for educational credit, as they usually would for their learner taking a course anywhere.
NextGenU.org is happy to provide your institution with:- A link to and description of the course training so that they can see all of its components, including the co-sponsoring institutions;
- Your grade on the final exam;
- Your work products (e.g., discussion forum responses) and any other required or optional shared materials that you produce and authorize to share with them;
- Your evaluations -- course and self-assessments;
- A copy of your Certificate of completion with the co-sponsoring organizations listed.
To obtain a degree, NextGenU.org co-sponsors degree programs with institutional partners. To get a whole degree co-sponsored with NextGenU.org, registrants must be enrolled in a degree program as a student of a NextGenU.org institutional partner. If your institution might be interested in offering a degree with NextGenU.org, contact us.
We hope you will find this a rewarding learning experience, and we count on your assessment and feedback to help us improve this training for future students.
Here are the following steps to take the course and earn a certificate:- Complete the registration form.
- Take the pre-test.
- Begin the course with Module 1:Introduction to Statistics and Research in Health Care. In each lesson, read the description, complete all required readings and any required activity, and take the corresponding quizzes.
-
Module 1: Introduction to Statistics and Research in Health Care
 Competency covered in this module:
 - MCAT: Identify the Role of theory, past findings, and observations in scientific questioning.
- MCAT: Reason about ethical issues in scientific research.
- Miami-Dade: Demonstrate an understanding of descriptive statistics by contrasting between the levels of data.
- MCAT: Distinguish between samples and populations.
- Miami-Dade: Demonstrate an understanding of descriptive statistics by contrasting between the levels of data.
- MCAT: Reason about random and systematic error.
- MCAT: Reason about the appropriateness, precision, and accuracy of tools used to conduct research in the natural sciences.
- MCAT: Reason about the appropriateness, reliability, and validity of tools used to conduct research.
- Miami-Dade: Demonstrate an understanding of descriptive statistics by: designing and formulating sources of decision-making data.
- MCAT: Identify the relationships among the variables in a study (e.g., independent versus dependent variables; control and confounding variables)
- MCAT: Identify testable research questions and hypotheses.
- MCAT: Reason about the features of research studies that suggest associations between variables or causal relationships between them (e.g., temporality, random assignment)
- Miami-Dade: Demonstrate an understanding of descriptive statistics by: designing and formulating sources of decision-making data.
-
Module 1: Lesson 1: Research, The Scientific Method, and the Role of Statistics in the Health Care Field
Student Learning Outcomes:
Upon completion of this lesson, you will be able to:
- Explain the role of theory, past findings and observations in scientific research.
- Discuss the steps of the scientific method as necessary for scientific research.
- Discuss the role and Identify instances of statistics being used in our daily lives and the in world around us.
- Explain the important role of ethics in research.
2 URLs, 1 Forum -
Module 1: Lesson 2: Data, Variables, Populations, Samples, and Measurement
Student Learning Outcomes:
Upon completion of this lesson, you will be able to:- Given a research situation, identify and classify the variables and data generated.
- Identify populations, samples, and frames in given statistical studies.
- Classify given measurements according to levels.
- Distinguish between the two categories of measurement error.
- Distinguish between accuracy and precision in measurements.
- Determine the level of accuracy and precision of measurements.
- Explain Validity and Reliability and their importance in research.
- Identify situations of reliability and validity in given measurement.
7 URLs -
Module 1: Lesson 3: Research Design and Data Collection
Student Learning Outcomes:
Upon completion of this lesson, you will be able to:- Describe and identify the various sources of data.
- Describe some methods and tools of data collection.
- Identify research variables and Describe the relationship between them.
- Generate testable research questions from an idea.
4 URLs -
Module 1: Lesson 4: Randomization and Sampling
Student Learning Outcomes:
Upon completion of this lesson, you will be able to:
- Discuss the importance of and identify instances of Random Selection and Random Assignment in Research.
-
Determine the sampling method that will best generate samples for a given situation in research.
- Explain the generation of a stratified, a cluster, a systematic, or any other types of sampling discussed in the text.
3 URLs, 1 Forum, 2 Quizzes -
Module 2: Graphical Methods of Describing Data
 Competency covered in this module:
 - MCAT: Use, analyze, and interpret data n figures, graphs, and tables.
- MCAT: Evaluate whether representations make sense for particular observations and data.
-
Module 2: Lesson 1: Displaying Univariate Data
Student Learning Outcomes:
Upon completion of this lesson, you will be able to:- Determine the appropriateness of, Create, and Interpret Graphical Representations of Univariate Data with: Pie Charts, Dot Plots, Stem-and-leaf Plots, and Frequency tables.
8 URLs -
Module 2: Lesson 2: Displaying Bivariate Data
Student Learning Outcomes:
Upon completion of this lesson, you will be able to:- Determine the appropriateness of, Create, and Interpret Graphical Representations of Bivariate Data with:: Scatterplots, Line Graphs, and Runs (Time Series) Plots.
5 URLs -
Module 2: Lesson 3: Communicating and Interpreting the Results of Graphical Statistical Analysis
Student Learning Outcomes:
Upon completion of this lesson, you will be able to:- Determine whether graphical representations of statistical analysis results are clearly communicated.
- Read and Interpret Statistical Graphs
2 URLs, 1 Forum -
Module 3: Numerical Methods of Describing Data: Summary Numbers
 Competency covered in this module:
 - MCAT: Use measures of Central Tendency and Measures of Dispersion to describe data.
- MCAT: Demonstrate an understanding of managing data by: evaluating and analyzing methods for examining central tendency; Formulating various techniques to analyze data dispersion; Assessing use of fractile measures such as quartiles and percentiles.
- MCAT: Use, analyze, and interpret data n figures, graphs, and tables.
- Miami-Dade: Demonstrate an understanding of descriptive statistics by: Interpreting and assessing data displayed using visual graphic presentation methods.
- MCAT: Reason about ethical issues in scientific research.
-
Module 3: Lesson 1: Measures of Central Tendency
Student Learning Outcomes:
Upon completion of this lesson, you will be able to:- Explain the concept of central tendency.
- Compute the midrange, midquartile, mean, median, mode, weighted, or combined mean of a given data set.
- Explain the weakness of the median and mean as measures of CT.
- Determine whether it is appropriate to use the mean, the median, and the mode to express the center of a given dataset.
5 URLs -
Module 3: Lesson 2: Measures of Dispersion
Student Learning Outcomes:
Upon completion of this lesson, you will be able to:- Explain dispersion in distributions.
- Compute the range, interquartile range, variance, and standard deviation of a given data distribution.
3 URLs -
Module 3: Lesson 3: Measures of Position
Student Learning Outcomes:
Upon completion of this lesson, you will be able to:- Find percentile and quartiles of a distribution.
- Explain the purpose of and compute the z-score of a measure within a distribution.
- Normalize scores from different distributions to compare them.
3 URLs -
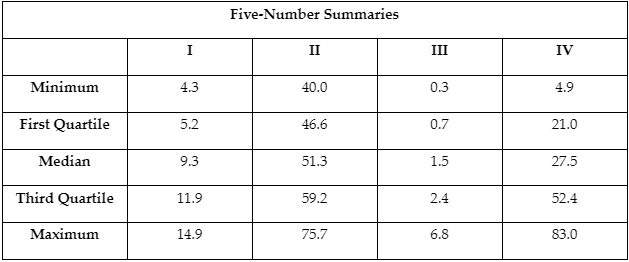
Module 3: Lesson 4: Using Boxplots to Summarize Datasets
Student Learning Outcomes:
Upon completion of this lesson, you will be able to:- Define basic terms including hinges (fences), H-spread, step, adjacent value, outside value (outlier), and far out value (far outlier).
- Use the 5-number summary to create boxplots to describe a dataset.
- Create and interpret side-by-side box (parallel) plots to compare two variables.
- Create an adjusted boxplot to identify outliers.
- Create an Adjusted Box Plot.
- Find Grouped Mean and Variance.
Click here to start this lesson3 URLs, 1 Forum -
Module 3: Lesson 5: Extra Topics on Describing Data
Student Learning Outcomes:
Upon completion of this lesson, you will be able to:- Distinguish between parameters and statistics.
- Explain and give examples of skew and kurtosis of a distribution.
- Identify and compare the relative positions of the mean and median and the difference between them as they are affected by skew.
- Illustrate some ways in which graphs and statistics can be used to mislead.
- Graph mixed bivariate data sets-
- interpret graphs for Time Series Data.
- Use numerical summaries with control charts to determine when a system is out-of-control.
6 URLs, 1 Forum, 1 Quiz -
Module 4: Probability, Random Variables, and Distributions
 Competency covered in this module:
 Miami-Dade: Compute basic probabilities as used in statistical applications by comparing the concepts of probability; demonstrating the elementary rules of probability; creating used for Bayes' Theorem, and differing among the counting rules. - Yale: random Variables, discrete, continuous, density functions. Mean and Variance of random variables, definitions, and properties.
-
Module 4: Lesson 1: Counting Rules
Student Learning Outcomes:
Upon completion of this lesson, you will be able to:- Determine the permutations and combinations of n items arranged r at a time.
1 URL -
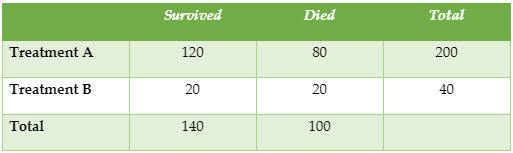
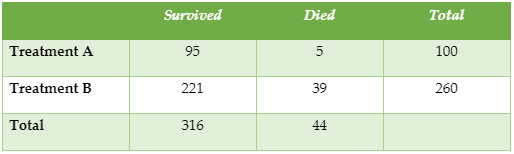
Module 4: Lesson 2: Probability Basics
Student Learning Outcomes:
Upon completion of this lesson, you will be able to:- Explain the meaning of the probability of an event A in a sample space S.
- Calculate the probability of a specified simple event in a chance experiment with equally likely outcomes determine simple probabilities using the complement rule, and frequencies or count.
- Determine compound probabilities using the addition rules for disjoint and non-disjoint events.
- Find the conditional probabilities of events.
- determine if two given events are independent.
- Find probabilities using the multiplication rule.
- Find probabilities using Bayes' Rule.
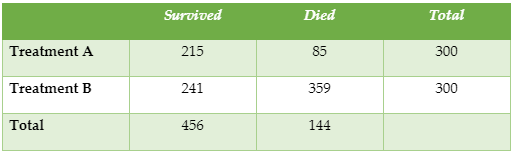
- Determine Sensitivity, Specificity, False Negative, and False Positive probabilities, the Prevalence of a disease, the Predictive Value Positive, and Predictive Value Negative of a Screening Test from a contingency table.
8 URLs, 1 Forum -
Module 4: Lesson 3: Random Variables
Student Learning Outcomes:
Upon completion of this lesson, you will be able to:- Explain the concept of a random variable.
- Distinguish between discrete and continuous random variables.
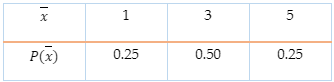
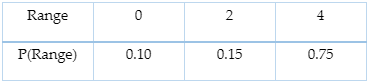
- Given the experiment, and the random variable defined, create the frequency, probability, and cumulative distributions, and their attendant graphs.
- Answer probability questions based on the distributions created from the random variable
2 URLs -
Module 4: Lesson 4: Discrete Random Variables and Discrete Distributions of Random Variables
Student Learning Outcomes:
Upon completion of this lesson, you will be able to:- Find the expected value (mean), variance, and standard deviation of a discrete random variable.
- Identify a situation in which a binomial random variable can be used to model and predict.
- Compute and interpret the mean and standard deviation of a binomial random variable.
- Calculate probabilities using the binomial distribution.
- Identify a situation in which a Poisson random variable can be used to model and predict.
- Calculate probabilities using the Poisson distribution.
4 URLs -
Module 4: Lesson 5: Continuous Random Variables and the Normal Distribution
Student Learning Outcomes:
Upon completion of this lesson, you will be able to:- Interpret the mean, standard deviation, and shape of probability distributions of continuous random variables.
- Explain the key features of the normal distribution.
- Calculate probabilities of a non-standard normal distribution using the standard normal distribution tables.
- Use the Empirical Rule to compute percentages under the curve of the normal distribution.
- Standard Normal Distribution Tables.
3 URLs, 1 Forum -
Module 5: Sampling Distributions
 Competency covered in this module:
 MCAT: Reason about statistical significance and uncertainty (e.g., interpreting statistical significance leve and confidence intervals.
-
Module 5: Lesson 1: Sampling Variablilty
Student Learning Outcomes:
Upon completion of this lesson, you will be able to:- Discuss the concept of variability of the sample statistics, and the connection between variability, the population parameter, and sample size.
1 URL -
Module 5: Lesson 2: Sampling Distributions
Student Learning Outcomes:
Upon completion of this lesson, you will be able to:- Explain the concept of a sampling distribution.
- Distinguish between the Sampling Distribution of the Mean, a distribution of the sample, and the population distribution.
1 URL -
Module 5: Lesson 3: The Central Limit Theorem
Student Learning Outcomes:
Upon completion of this lesson, you will be able to:- Explain the Central Limit Theorem (CLT) and its importance in Inferential Statistics.
-
Find and apply the mean and standard error of the sampling distribution of the mean, as summarized by the CLT.
2 URLs, 1 Forum -
Module 6: Estimation
 Competency covered in this module:
 - MCAT: Relating statistical significance and uncertainty to conclusions that can or cannot be made about the study.
- MCAT: Using data to explain relationships between variables.
-
Module 6: Lesson 1: Estimation
Student Learning Outcomes:
Upon completion of this lesson, you will be able to:- Explain why we need to estimate.
-
Distinguish between point and interval estimates.
- Explain what a margin of error is.
- Find the margin of error given the confidence interval limits.
- Explain what a confidence interval is.
1 URL - Explain why we need to estimate.
-
Module 6: Lesson 2: Confidence Intervals on Single Means and Proportions
Student Learning Outcomes:
Upon completion of this lesson, you will be able to:- Compute and interpret a confidence interval on the mean when σ is known.
-
t-Distribution Tables.
- Determine whether to use a t-distribution or a normal distribution to compute confidence intervals.
- Compute a confidence interval on the mean when σ is estimated.
- Compute and interpret confidence intervals for proportions.
2 URLs, 1 Forum - Compute and interpret a confidence interval on the mean when σ is known.
-
Module 6: Lesson 3: Confidence Intervals on Differences of Two Means and Proportions
Student Learning Outcomes:
Upon completion of this lesson, you will be able to:- Find and Interpret the Confidence Interval for the Difference in Means of Two Independent Samples.
-
Find and Interpret the Confidence Interval for the Difference in Two Proportions.
2 URLs - Find and Interpret the Confidence Interval for the Difference in Means of Two Independent Samples.
-
Module 7: Testing of Hypotheses
 Competency covered in this module:
 - MCAT: Use data to answer research questions and draw conclusions.
- MCAT: Identify testable research questions and hypotheses.
- MCAT: Identify conclusions that are supported by research results and determine the implications of results for real-world situations.
- MCAT: Distinguish between results that do and do not support generalizations about populations.
-
Module 7: Lesson 1: The Basics of Hypothesis Testing
Student Learning Outcomes:
Upon completion of this lesson, you will be able to:- Explain the meaning of the term "statistically significant."
- Determine the null and alternative hypotheses from a description of an experiment.
-
Describe how a p-value is used to cast doubt on the null hypothesis.
- Differentiate between Type I and Type II errors.
- State the null hypothesis for both one-tailed and two-tailed tests for a given Hypothesis test.
9 URLs - Explain the meaning of the term "statistically significant."
-
Module 7: Lesson 2: Hypothesis Testing of the Population Mean and Proportion
Student Learning Outcomes:
Upon completion of this lesson, you will be able to:- Perform one- and two-tailed hypothesis tests for the mean in the case when is known (or for a large sample), using the steps involved in significance testing.
-
Perform one- and two-tailed hypothesis tests for the mean in the case when has to be estimated (of for a small sample), using the steps involved in significance testing.
- Use the steps involved in significance testing to perform one- and two-tailed hypotheses tests for the single proportion.
3 URLs - Perform one- and two-tailed hypothesis tests for the mean in the case when is known (or for a large sample), using the steps involved in significance testing.
-
Module 7: Lesson 3: Testing Two Samples
Student Learning Outcomes:
Upon completion of this lesson, you will be able to:- Explain the steps involved in significance testing for the difference in the means of two independent samples.
-
Explain the steps involved in significance testing for the difference in the means of paired samples.
- Explain the steps involved in significance testing for the difference in two proportions.
3 URLs - Explain the steps involved in significance testing for the difference in the means of two independent samples.
-
Module 7: Lesson 4: Testing with Categorical Variables
Student Learning Outcomes:
Upon completion of this lesson, you will be able to:- Describe the Chi-Square distribution.
-
Perform and interpret a Chi-Square test for Independence.
- Perform and interpret a Chi-Square Goodness-of-Fit test.
9 URLs, 1 Forum, 1 Quiz - Describe the Chi-Square distribution.
-
Module 8: Introduction to Linear Regression Analysis
 Competency covered in this module:
 - MCAT: Use data to explain relationships between variables or make predictions.
-
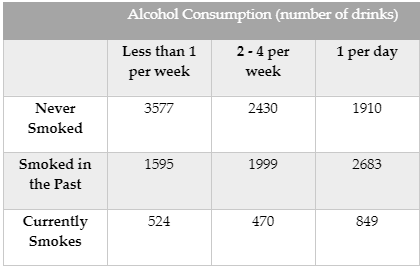
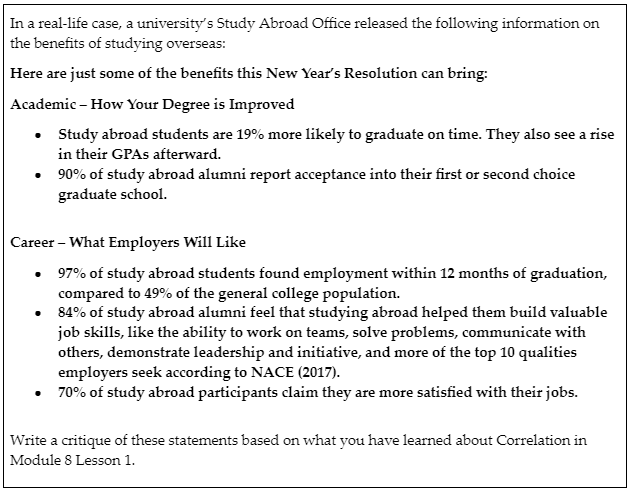
Module 8: Lesson 1: Linear Correlation
Student Learning Outcomes:
Upon completion of this lesson, you will be able to:- Explain the concept of correlation and how it differs from causation.
-
Identify positive and negative associations from a scatter plot.
- Calculate r, the correlation coefficient of the two variables.
- Utilize the rule of thumb for the interpretation of the calculated correlation coefficient.
- Differentiate between the coefficient of correlation and the coefficient of determination.
- Test the Correlation Coefficient for Significance.
5 URLs, 1 Forum - Explain the concept of correlation and how it differs from causation.
-
Module 8: Lesson 2: The Basics of Linear Regression
Student Learning Outcomes:
Upon completion of this lesson, you will be able to:- Explain the concept of Linear Regression.
-
Find the Linear Regression equation and use it to Predict.
- Test the Outliers, Influential Observations, and Leverage Points.
4 URLs - Explain the concept of Linear Regression.
-
Course and Self Evaluation & Certificate
 In this section, you can provide feedback about this course to help us make NextGenU.org better. Once evaluations are completed, you will be able to download your certificate of completion.