

Section: Module 3: Numerical Methods of Describing Data: Summary Numbers | Intro to Statistics for Izmir University of Economics Faculty of Medicine Cohort | NextGenU.org
-
 Competency covered in this module:
 - MCAT: Use measures of Central Tendency and Measures of Dispersion to describe data.
- MCAT: Demonstrate an understanding of managing data by: evaluating and analyzing methods for examining central tendency; Formulating various techniques to analyze data dispersion; Assessing use of fractile measures such as quartiles and percentiles.
- MCAT: Use, analyze, and interpret data n figures, graphs, and tables.
- Miami-Dade: Demonstrate an understanding of descriptive statistics by: Interpreting and assessing data displayed using visual graphic presentation methods.
- MCAT: Reason about ethical issues in scientific research.
-
Students mustView
Read entire page. (12 minutes)
Rice University - 2021
-
Students mustView
Watch the entire video. (11 minutes)
Rice University - 2021
-
Students mustView
Read entire page and do the set of five (5) questions at the bottom of the page. (10 minutes)
Rice University - 2021
-
Students mustView
Watch the entire video. (21 minutes)
2023
-
Students mustView
Read entire page. (3 minutes)
Michigan State University - 2016
-
-
Students mustView
Watch entire video. (7 minutes)
Rice University - 2021
-
-
Students mustView
Read entire page. (7 minutes)
Penn State University, Eberly College of Science - 2022
-
Students mustView
Watch all slides. (20 minutes)
Cal State University, Northridge - 2021
-
Students mustView
Read entire page. (6 minutes)
University of Texas at Dallas - 2022
-
Quiz: Module 3: Lessons 1, 2 & 3
To access the quiz, click on the name of the quiz provided above. On the following screen, click the "Preview quiz now" button to respond to the questions.
TO PASS THIS QUIZ YOU MUST OBTAIN A SCORE OF 80%.
-
Students mustView
Read entire Page and answer questions at the bottom of the page. (11 minutes)
Rice University - 2021
-
Students mustView
Watch entire video. (8 minutes)
Rice University - 2021
-
Students mustView
Watch entire video. (18 minutes)
-
Students mustViewStart discussions: 1
Student Learning outcome: Use the Five-Number Summary to Create a Boxplot to Describe a Data Set
In this activity, you will investigate the relationship between boxplot shapes and the corresponding five-number summary.Step 1. Review
Review the learning resources for this lesson before studying the case problem.
Step 2. Analyze
Analyze the case problem below.
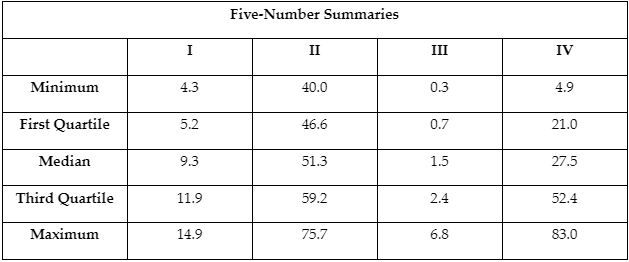
The accompanying figure shows four boxplots labeled A to D. Also given are four five-number summaries, labeled I to IV. Match each five-number summary to the appropriate boxplot. Note that scales are not included on the boxplots, so you will have to consider what the five-number summary implies about the characteristics of the boxplot.
Step 3. Respond
Respond to the case problem by showing the boxplot properties, logic steps, and reasoning you used to match each figure with its corresponding five-number summary.
Step 4. Share
To share your work, access to the first post below and click on the “Reply” button under this post and paste your work into the “Message” box. Make sure to reference others’ intellectual property when necessary. All references should follow 7th Edition APA formatting. For further instructions, see the resource on the Himmelfarb Health Sciences Library: APA citation resource (N.B. references are excluded from word counts).
OPTIONAL Step 5: Interact (10 minutes)
If you would like to, you can reply to your peers' posts in a respectful and professional manner. Ensure that your post engages your peers' ideas by including a reflection on their comments, sharing ideas of other potential difficulties and parties involved, or asking thought-provoking questions. If a peer comments on your posting, please reply. To post a reply, click “Reply” on a particular discussion, write your feedback and then click on “Post to forum.”
-
Students mustView
Read the page to the end of 'Samples and Statistics' section. (5 minutes)
Penn State University - 2022
-
Students mustView
Read entire page, paying more attention to the concepts than to the formulas. (8 minutes)
Mustansiriyah University - 2021
-
Students mustView
Read entire page. (7 minutes)
UC Davis - 2022
-
Students mustView
Read entire page. (10 minutes)
Arkansas Tech University - 2021
-
-
Students mustView
Read entire page. (8 minutes)
(ASQ) American Society for Quality - 2022
-
Students mustViewStart discussions: 1
In this activity, you will discuss factors of data collection that affect the shape, particularly the skewness, of the data distribution.
Step 1. Review
Review the learning resources for this lesson before answering the question.
Step 2. Analyze
Analyze and discuss the question below.
 Step 3. Respond
Respond to the case problem by writing a 300-500-word discussion post with the following inclusions.
Step 4. Share
To share your work, click on the “Add a new discussion topic” button under this post and paste your work into the “Message” box. Make sure to reference others’ intellectual property when necessary. All references should follow 7th Edition APA formatting. For further instructions, see the resource on the Himmelfarb Health Sciences Library: APA citation resource (N.B. references are excluded from word counts).
OPTIONAL Step 5: Interact (10 minutes)
If you would like to, you can reply to your peers' posts in a respectful and professional manner. Ensure that your post engages your peers' ideas by including a reflection on their comments, sharing ideas of other potential difficulties and parties involved, or asking thought-provoking questions. If a peer comments on your posting, please reply. To post a reply, click “Reply” on a particular discussion, write your feedback and then click on “Post to forum.”
-
Quiz: Module 3: Lessons 4 & 5
To access the quiz, click on the name of the quiz provided above. On the following screen, click the attempt quiz button to view the case studies and respond to the questions.
TO PASS THIS QUIZ YOU MUST OBTAIN A SCORE OF 80%.
-
Students mustViewReceive a gradeReceive a passing grade
To access the quiz, click on the name of the quiz provided above. On the following screen, click the "Preview quiz now" button to respond to the questions.
