
-
Show More
-
 Welcome to Intro to Statistics, a course developed by NextGenU.org as part of the Mathematics series for the Health Sciences Training Certificate.
This version of the course has been prepared for students of the Izmir University of Economics and includes the first three modules of the full Intro to Statistics course.
The course introduces foundational statistical concepts and methods used in health and scientific research. Through the three modules, students will develop skills in understanding the role of statistics in health care and research, organizing and presenting data graphically, and summarizing data using numerical methods.
Course Modules
There are eight modules in the full course, however, students of the Izmir University of Economics are required to complete the following three modules:
-
Module 1: Introduction to Statistics and Research in Health Care
-
Module 2: Graphical Methods of Describing Data
-
Module 3: Numerical Methods of Describing Data: Summary Numbers
These modules are drawn from the full eight-module NextGenU.org Intro to Statistics course.
Course Development and Partners
The International Development Research Centre and the University of the Incarnate Word School of Osteopathic Medicine partly sponsor the Intro to Statistics course
. Like all NextGenU.org courses, it is competency-based, using competencies based on the Association of American Medical Colleges' Medical College Admission Test. It uses learning resources from accredited, academic, professional, and world-class organizations and universities such as Rice University. Volunteer designers for this course include Shaunik Sharma, BSc; Tristan Aaron Wild, BMSc (Hons); and the late Mohammad Asadi-Lari, a former MD-PHD Candidate at the University of Toronto. The course was created by Marco Aurelio Hernandez, Ph. D., Alixandria Ali, BSc, and Pablo Baldiviezo, MD. MSc. DiplEd.
For publications on the efficacy of NextGenU.org's courses, see NextGenU.org's publication page.
Course Completion
Students should complete all required components within Modules 1–3, including:
-
Required readings and learning resources;
-
Required quizzes;
-
Required discussion forums; and
-
Required practical or learning activities.
Practice quizzes consisting of multiple-choice questions are included throughout the modules to help students check their understanding and reinforce key concepts.
Students should follow any additional assessment, grading, or completion requirements provided by the Izmir University of Economics for this offering of the course.
Engaging with this Course
Begin by completing the course registration requirements and any assigned pre-course assessment. Then proceed through the modules in order, beginning with Module 1: Introduction to Statistics and Research in Health Care.
Within each lesson:
-
Review the lesson description and learning objectives;
-
Complete all required readings and learning resources;
-
Complete any required activities or discussion forums; and
-
Complete the corresponding quizzes.
We hope you find this a rewarding learning experience. Your assessment and feedback will help NextGenU.org and its partners continue to improve the training for future learners.
-
-
 Competency covered in this module:
 - MCAT: Identify the Role of theory, past findings, and observations in scientific questioning.
- MCAT: Reason about ethical issues in scientific research.
- Miami-Dade: Demonstrate an understanding of descriptive statistics by contrasting between the levels of data.
- MCAT: Distinguish between samples and populations.
- Miami-Dade: Demonstrate an understanding of descriptive statistics by contrasting between the levels of data.
- MCAT: Reason about random and systematic error.
- MCAT: Reason about the appropriateness, precision, and accuracy of tools used to conduct research in the natural sciences.
- MCAT: Reason about the appropriateness, reliability, and validity of tools used to conduct research.
- Miami-Dade: Demonstrate an understanding of descriptive statistics by: designing and formulating sources of decision-making data.
- MCAT: Identify the relationships among the variables in a study (e.g., independent versus dependent variables; control and confounding variables)
- MCAT: Identify testable research questions and hypotheses.
- MCAT: Reason about the features of research studies that suggest associations between variables or causal relationships between them (e.g., temporality, random assignment)
- Miami-Dade: Demonstrate an understanding of descriptive statistics by: designing and formulating sources of decision-making data.
-
Students mustView
Read from Pages 3-6: Defining Science to Pages 3-18: Common Sense and Science. (30 minutes)
University of Central Arkansas - 2013
-
Students mustView
Read the entire page. (22 minutes)
US Government; National Institute of Environmental Health Sciences - 2021
-
Students mustViewStart discussions: 1
In this activity, you will discuss the issue of the indispensable use of statistics, despite it being an imperfect science and measure.
Step 1. Review
Review the learning resources for this lesson before answering the question.
Step 2. Analyze
Analyze and discuss the question below.

Step 3. Respond
Respond to the case problem by writing a 300-500-word discussion post with the following inclusions.
Step 4. Share
To share your work, click on the “Add a new discussion topic” button under this post and paste your work in the “Message” box. Make sure to reference others’ intellectual property when necessary. All references should follow 7th Edition APA formatting. For further instructions, see the resource on the Himmelfarb Health Sciences Library: APA citation resource (N.B. references are excluded from word counts).
OPTIONAL Step 5: Interact (10 minutes)
If you would like to, you can reply to your peers' posts in a respectful and professional manner. Ensure that your post engages your peers' ideas by including a reflection on their comments, sharing ideas of other potential difficulties and parties involved, or asking thought-provoking questions. If a peer comments on your posting, please reply. To post a reply, click “Reply” on a particular discussion, write your feedback and then click on “Post to forum.”
-
-
Students mustView
Click on and Read the "Types of Data" section. (10 minutes)
Andrews College - 2019
-
Students mustView
Read entire page. (2 minutes)
Penn State Eberly College of Science - 2022
-
Students mustView
Read the Entire Page: Levels of Measurement, and try the set of six questions at the bottom of the page. (10 minutes)
Rice University - 2021
-
Students mustView
Read from beginning up to the end of section titled 'We Can Not Avoid Them'. (6 minutes)
University of Oregon - 2017
-
Students mustView
Read entire page. (6 minutes)
University of Hawaii - 2022
-
Students mustView
Read entire page. (13 minutes)
Washington State University - 2022
-
Quiz: Module1: Lessons 1 & 2
To access the quiz, click on the name of the quiz provided above. On the following screen, click the "Preview quiz now" button to respond to the questions.
TO PASS THIS QUIZ YOU MUST OBTAIN A SCORE OF 80%.
-
Students mustMark as done
Module 1: Lesson 3: Research Design and Data Collection
Student Learning Outcomes:
Upon completion of this lesson, you will be able to:
- Describe and identify the various sources of data.
- Describe some methods and tools of data collection.
- Identify research variables and Describe the relationship between them.
- Generate testable research questions from an idea.
Approximate time required for the readings for this lesson (at 144 words/minute): 1 hour and 51 minutes.
Required Learning Resources and Activities
-
Students mustView
Read entire page. (3 minutes)
Australian Bureau of Statistics - 2022
-
Students mustView
Read entire page. (10 minutes)
Australian Bureau of Statistics - 2022
-
Students mustView
Read Entire page. (10 minutes)
Samarpan Institute of Nursing Sciences - 2013
-
Students mustView
Read entire page and watch included video. (14 minutes)
Research Methods in Psychology - 2015
-
Students mustView
Read entire page. (2 minutes)
San Diego State University - 2021
-
Students mustView
Read entire page. (2 minutes)
San Diego State University - 2021
-
Students mustView
Read up to the end of page 14. (30 minutes)
University of Central Arkansas - 2013
-
Students mustViewStart discussions: 1
Student Learning outcome (Module 1 Lesson 4): Discuss the importance of and identify instances of Random Selection and Random Assignment in Research.
Step 1. Review
Review the learning resources for this lesson before studying the case problem.
Step 2. Analyze
Analyze the case problem below.
A new drug is introduced. How should an experiment be designed to test its effectiveness? The primary method is comparison. The drug is given to subjects in a treatment group, but other subjects are used as controls ‒ they aren’t treated. The treatment and control groups should be as similar as possible ‒ except for the treatment. Then the responses of the two groups are compared. Subjects should be assigned to the groups at random. A randomized controlled assignment is when an impartial chance procedure is used to assign the subjects to treatment or control. This method provides the best assurance of validity and reliability. However, randomized controlled experiments are hard to do. As a result, doctors often use other designs which are not as good. For example, a new treatment can be tried out on one group of patients, who are compared to “historical controls:” patients treated the old way in the past. Usually, using historical controls, assignment to the groups is not randomized, resulting in a poorly-designed experiment. The problem is that the treatment and historical groups may differ in important ways besides the treatment.
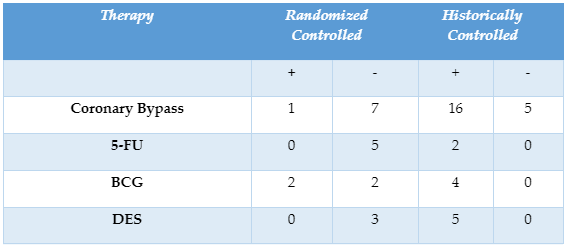
Coronary bypass surgery is a widely used ‒ and very expensive ‒ operation for coronary artery disease. Chalmers and associates identified 29 trials of this surgery (first line of the table below). There were 8 randomized controlled trials, and 7 were quite pessimistic about the value of the operation. By comparison, there were 21 trials with historical controls, and 16 were positive. Three other therapies were evaluated: 5-FU, used in chemotherapy for colon cancer; BCG, used to treat melanoma; and DES, used to prevent miscarriage. The data are given below.
Table 1: A study of studies. Four therapies were evaluated by randomized controlled trials and by trials using historical controls. Conclusions of trials are summarized as positive about the value of the therapy (+) or negative (-).
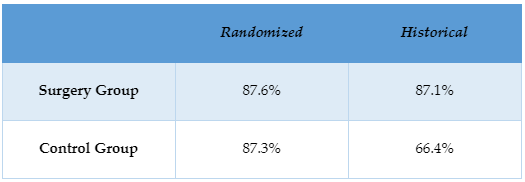
Why are the randomized controlled studies less enthusiastic, and the less well-designed studies more enthusiastic about the value of the surgery?
Look at it in view of the data in the table below.
Table 2: Randomized controlled experiments vs. studies with historical controls: three-year survival rates for surgery patients and patients used as controls in trials of coronary bypass surgery.
Step 3. Respond
Respond to the case problem by answering the question: Why are the randomized controlled studies less enthusiastic and the less well-designed studies more enthusiastic about the value of the surgery?
Step 4. Share
To share your work, access to the first post below and click on the “Reply” button under this post and paste your work into the “Message” box. Make sure to reference others’ intellectual property when necessary. All references should follow 7th Edition APA formatting. For further instructions, see the resource on the Himmelfarb Health Sciences Library: APA citation resource (N.B. references are excluded from word counts).
OPTIONAL Step 5: Interact (10 minutes)
If you would like to, you can reply to your peers' posts in a respectful and professional manner. Ensure that your post engages your peers' ideas by including a reflection on their comments, sharing ideas of other potential difficulties and parties involved, or asking thought-provoking questions. If a peer comments on your posting, please reply. To post a reply, click “Reply” on a particular discussion, write your feedback and then click on “Post to forum.”
-
Students mustViewReceive a gradeReceive a passing grade
To access the quiz, click on the name of the quiz provided above. On the following screen, click the "Preview quiz now" button to respond to the questions.
-
Students mustViewReceive a gradeReceive a passing grade
To access the quiz, click on the name of the quiz provided above. On the following screen, click the "Preview quiz now" button to respond to the questions.
-
 Competency covered in this module:
 - MCAT: Use, analyze, and interpret data n figures, graphs, and tables.
- MCAT: Evaluate whether representations make sense for particular observations and data.
-
Students mustView
Read entire page. (7 minutes)
Rice University - 2021
-
Students mustView
Watch the entire video. (7 minutes)
Rice University - 2021
-
-
-
Students mustView
Watch entire video. (9 minutes)
Rice University - 2021
-
-
Students mustView
Watch the entire video. (6 minutes)
Rice University - 2021
-
Students mustView
Watch entire video. (23 minutes)
2023
-
Students mustMark as done
Module 2: Lesson 2: Displaying Bivariate Data
Student Learning Outcomes:
Upon completion of this lesson, you will be able to:
- Determine the appropriateness of, Create, and Interpret Graphical Representations of Bivariate Data with:: Scatterplots, Line Graphs, and Runs (Time Series) Plots.
Approximate time required for the readings for this lesson (at 144 words/minute): 1 hour and 18 minutes.
Required Learning Resources and Activities
-
Students mustView
Read entire page. (6 minutes)
Statistics Canada, Government of Canada - 2021
-
-
Students mustView
Watch entire video. (5 minutes)
Rice University - 2021
-
Students mustView
Read entire page. (4 minutes)
Clinical Excellence Commission, Govt. of Australia - 2022
-
-
Students mustMark as done
Module 2: Lesson 3: Communicating and Interpreting the Results of Graphical Statistical Analysis
Student Learning Outcomes:
Upon completion of this lesson, you will be able to:
- Determine whether graphical representations of statistical analysis results are clearly communicated.
- Read and Interpret Statistical Graphs
Approximate time required for the readings for this lesson (at 144 words/minute): 3 hours and 17 minutes.
Required Learning Resources and Activities
-
Students mustView
Read Up to and including Page 19. (20 minutes)
State of Washington Government - 2017
-
Students mustView
Read entire page. (13 minutes)
Vanderbilt University, Dept of Biostatistics - 2021
-
Students mustViewStart discussions: 1
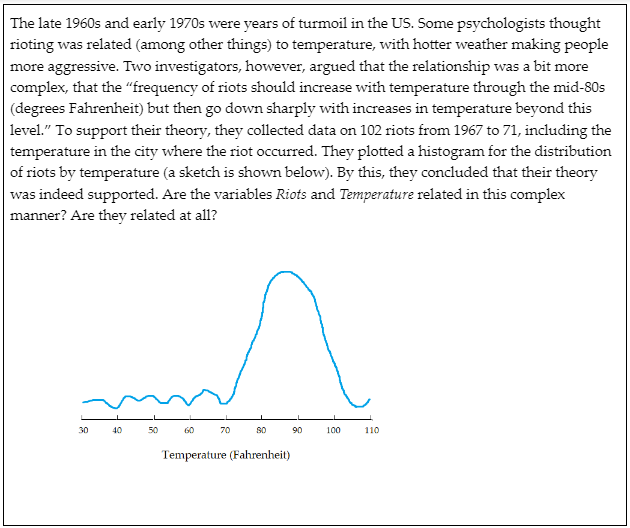
In this activity, you will discuss the interpretation of statistical graphs and the relationship between variables.
Step 1. Review
Review the learning resources for this lesson before answering the question.
Step 2. Analyze
Analyze and discuss the question below.
Step 3. Respond
Respond to the case problem by writing a 300-500-word discussion post with the following inclusions.
Step 4. Share
To share your work, click on the “Add a new discussion topic” button under this post and paste your work in the “Message” box. Make sure to reference others’ intellectual property when necessary. All references should follow 7th Edition APA formatting. For further instructions, see the resource on the Himmelfarb Health Sciences Library: APA citation resource (N.B. references are excluded from word counts).
OPTIONAL Step 5: Interact (10 minutes)
If you would like to, you can reply to your peers' posts in a respectful and professional manner. Ensure that your post engages your peers' ideas by including a reflection on their comments, sharing ideas of other potential difficulties and parties involved, or asking thought-provoking questions. If a peer comments on your posting, please reply. To post a reply, click “Reply” on a particular discussion, write your feedback and then click on “Post to forum.”
-
Quiz: Module 2
To access the quiz, click on the name of the quiz provided above. On the following screen, click the attempt quiz button to view the case studies and respond to the questions.
TO PASS THIS QUIZ YOU MUST OBTAIN A SCORE OF 80%.
-
 Competency covered in this module:
 - MCAT: Use measures of Central Tendency and Measures of Dispersion to describe data.
- MCAT: Demonstrate an understanding of managing data by: evaluating and analyzing methods for examining central tendency; Formulating various techniques to analyze data dispersion; Assessing use of fractile measures such as quartiles and percentiles.
- MCAT: Use, analyze, and interpret data n figures, graphs, and tables.
- Miami-Dade: Demonstrate an understanding of descriptive statistics by: Interpreting and assessing data displayed using visual graphic presentation methods.
- MCAT: Reason about ethical issues in scientific research.
-
Students mustView
Read entire page. (12 minutes)
Rice University - 2021
-
Students mustView
Watch the entire video. (11 minutes)
Rice University - 2021
-
Students mustView
Read entire page and do the set of five (5) questions at the bottom of the page. (10 minutes)
Rice University - 2021
-
Students mustView
Watch the entire video. (21 minutes)
2023
-
Students mustView
Read entire page. (3 minutes)
Michigan State University - 2016
-
-
Students mustView
Watch entire video. (7 minutes)
Rice University - 2021
-
-
Students mustView
Read entire page. (7 minutes)
Penn State University, Eberly College of Science - 2022
-
Students mustView
Watch all slides. (20 minutes)
Cal State University, Northridge - 2021
-
Students mustView
Read entire page. (6 minutes)
University of Texas at Dallas - 2022
-
Quiz: Module 3: Lessons 1, 2 & 3
To access the quiz, click on the name of the quiz provided above. On the following screen, click the "Preview quiz now" button to respond to the questions.
TO PASS THIS QUIZ YOU MUST OBTAIN A SCORE OF 80%.
-
Students mustView
Read entire Page and answer questions at the bottom of the page. (11 minutes)
Rice University - 2021
-
Students mustView
Watch entire video. (8 minutes)
Rice University - 2021
-
Students mustView
Watch entire video. (18 minutes)
-
Students mustViewStart discussions: 1
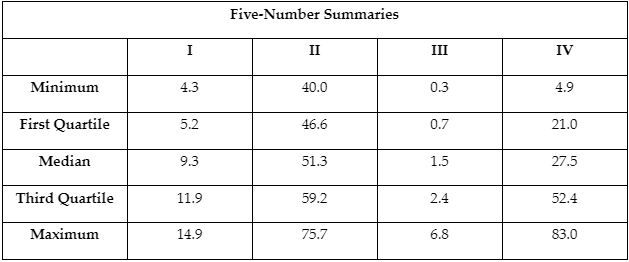
Student Learning outcome: Use the Five-Number Summary to Create a Boxplot to Describe a Data Set
In this activity, you will investigate the relationship between boxplot shapes and the corresponding five-number summary.Step 1. Review
Review the learning resources for this lesson before studying the case problem.
Step 2. Analyze
Analyze the case problem below.
The accompanying figure shows four boxplots labeled A to D. Also given are four five-number summaries, labeled I to IV. Match each five-number summary to the appropriate boxplot. Note that scales are not included on the boxplots, so you will have to consider what the five-number summary implies about the characteristics of the boxplot.
Step 3. Respond
Respond to the case problem by showing the boxplot properties, logic steps, and reasoning you used to match each figure with its corresponding five-number summary.
Step 4. Share
To share your work, access to the first post below and click on the “Reply” button under this post and paste your work into the “Message” box. Make sure to reference others’ intellectual property when necessary. All references should follow 7th Edition APA formatting. For further instructions, see the resource on the Himmelfarb Health Sciences Library: APA citation resource (N.B. references are excluded from word counts).
OPTIONAL Step 5: Interact (10 minutes)
If you would like to, you can reply to your peers' posts in a respectful and professional manner. Ensure that your post engages your peers' ideas by including a reflection on their comments, sharing ideas of other potential difficulties and parties involved, or asking thought-provoking questions. If a peer comments on your posting, please reply. To post a reply, click “Reply” on a particular discussion, write your feedback and then click on “Post to forum.”
-
Students mustView
Read the page to the end of 'Samples and Statistics' section. (5 minutes)
Penn State University - 2022
-
Students mustView
Read entire page, paying more attention to the concepts than to the formulas. (8 minutes)
Mustansiriyah University - 2021
-
Students mustView
Read entire page. (7 minutes)
UC Davis - 2022
-
Students mustView
Read entire page. (10 minutes)
Arkansas Tech University - 2021
-
-
Students mustView
Read entire page. (8 minutes)
(ASQ) American Society for Quality - 2022
-
Students mustViewStart discussions: 1
In this activity, you will discuss factors of data collection that affect the shape, particularly the skewness, of the data distribution.
Step 1. Review
Review the learning resources for this lesson before answering the question.
Step 2. Analyze
Analyze and discuss the question below.
 Step 3. Respond
Respond to the case problem by writing a 300-500-word discussion post with the following inclusions.
Step 4. Share
To share your work, click on the “Add a new discussion topic” button under this post and paste your work into the “Message” box. Make sure to reference others’ intellectual property when necessary. All references should follow 7th Edition APA formatting. For further instructions, see the resource on the Himmelfarb Health Sciences Library: APA citation resource (N.B. references are excluded from word counts).
OPTIONAL Step 5: Interact (10 minutes)
If you would like to, you can reply to your peers' posts in a respectful and professional manner. Ensure that your post engages your peers' ideas by including a reflection on their comments, sharing ideas of other potential difficulties and parties involved, or asking thought-provoking questions. If a peer comments on your posting, please reply. To post a reply, click “Reply” on a particular discussion, write your feedback and then click on “Post to forum.”
-
Quiz: Module 3: Lessons 4 & 5
To access the quiz, click on the name of the quiz provided above. On the following screen, click the attempt quiz button to view the case studies and respond to the questions.
TO PASS THIS QUIZ YOU MUST OBTAIN A SCORE OF 80%.
-
Students mustViewReceive a gradeReceive a passing grade
To access the quiz, click on the name of the quiz provided above. On the following screen, click the "Preview quiz now" button to respond to the questions.
-

To take the final exam, you must complete all quizzes and complete all the required activities. The final exam consists of 37 questions, and you will have 95 minutes to complete it. When the time is over, you will have two minutes to submit your attempt before it expires, and your progress is discarded. You will not be able to answer additional questions in the grace period.
To access the exam, click on the name of the exam provided above. On the following screen, click the attempt quiz button to respond to the questions.
-
-
Students mustMark as done
-
Students mustMark as done
-
-


