Module 3: Analyzing and Visualizing Data with SPSS
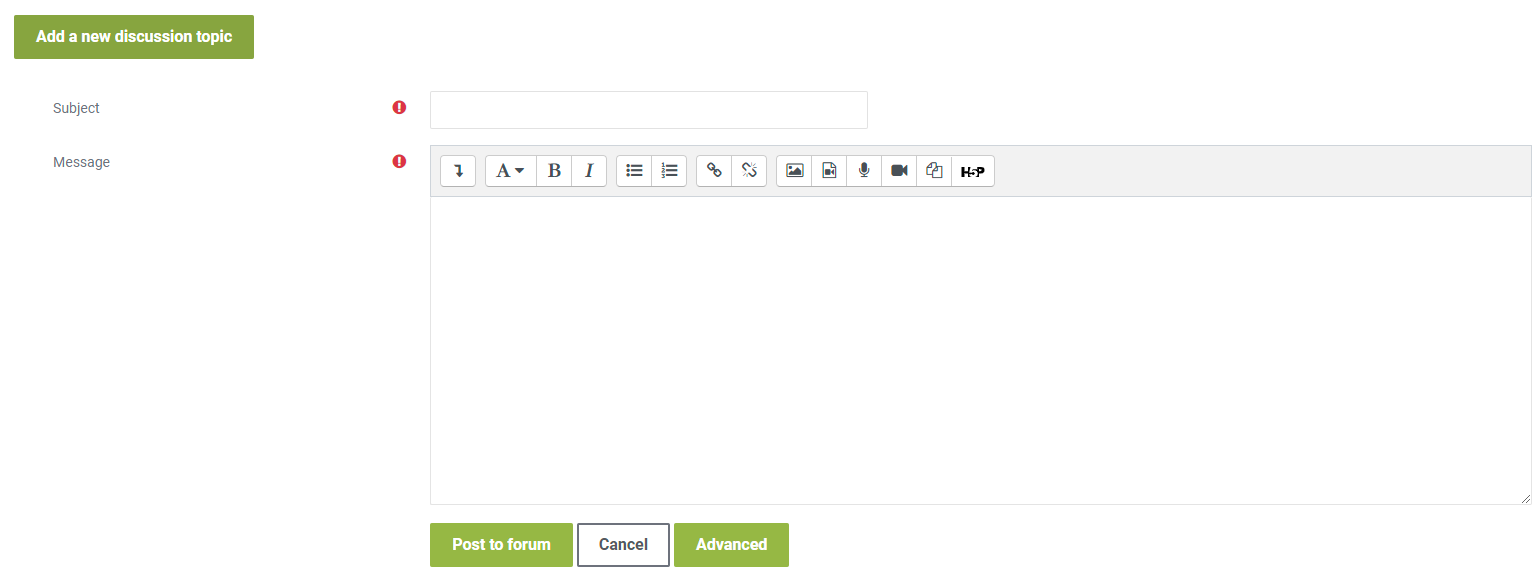
Objective: The objective of this activity is to apply the skills and knowledge you have obtained in Module 3. You will be working with SPSS to find summary numbers, create graphs for univariate and bivariate data, and produce frequency tables and histograms. Instructions: Deliverable: For this activity, submit a document that: This comprehensive activity will help you achieve the following learning outcomes: Note: Be mindful of privacy and confidentiality obligations when using and sharing data. Ensure the data you use for this exercise is either made up or anonymized to prevent any violations of these obligations. To share your work, click on the “Add a new discussion topic” button at the bottom of this post, then click on the “Advanced” button as shown in the picture below. Drag and drop your completed template inside the “Attachment” as shown in the picture below and click on “Post” after you have uploaded your completed template. To complete this activity, you will need to reply to at least one post made by your peers respectfully and professionally. Be sure that your post engages your peers' ideas by providing feedback on their comments, sharing ideas of other potential problems/solutions, or asking thought-provoking questions. If a peer comments on your posting, please reply. To post a reply, click “Reply” on a particular discussion list below, write your feedback and then click on “Post to forum.”