

Section: Module 1: The Basics of Biostatistics | Biostatistics | NextGenU.org
-
Before starting this first module, please take a moment to take the short knowledge Pre-test above. It allows us to assess various aspects of the course itself and is mandatory to receive your certificate upon completion of the course.
Competencies covered in this module:

- Describe the roles biostatistics serves in the discipline of public health.
- Distinguish among the different measurement scales and the implications for selection of statistical methods to be used based on these distinctions.
- Apply descriptive techniques commonly used to summarize public health data.
- Apply descriptive and inferential methodologies according to the type of study design for answering a particular research question.
-
Students mustViewWatch the entire video.
-
Students mustView
- Read down from the slide titled "What is statistics?" (page 7 in the Adobe Toolbar).
- Understand the basic principles of probability, descriptive statistics, and data analysis.
-
Students mustView
- Read down to the beginning of the subsection titled "Parametric and Non-Parametric Tests".
- The rest of the article is considered supplemental reading. Ensure you click on the link to the erratum for the corrected version of Table 2.
- Understand the basic principles of probability, descriptive statistics, and data analysis.
-
Students mustViewExplore The University of North Carolina's web page and interact with Lesson 1 and 2. Begin by reviewing Lesson 1's measurement scale definitions to understand data types, then read Lesson 2 (Descriptive Statistics) in full, paying special attention to the three basic descriptive characteristics section, the "OK to Compute" table, and all three examples; other lessons are optional. (26 minutes)
-
Quiz: Module 1: Lesson 1
To access the quiz, click on the name of the quiz provided above. On the following screen, click the "Preview quiz now" button to respond to the questions.
TO PASS THIS QUIZ, YOU MUST OBTAIN A SCORE OF 80%
-
Module 1: Lesson 2: Types of Variables, Plots, and Graphs
Student Learning Objectives:
Upon completion of this lesson, you will be able to:
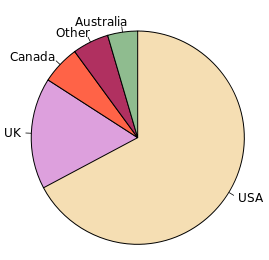
- Understand the different types of variables, how they are used, and how to summarize the data.
- Understand and identify the different types of plots and graphs.
Approximate time required to complete the readings (at 144 words/minute) and assignments for this module: 2 hours.
Required Learning Resources and Activities
-
Students mustView
- Read the entire web page.
- Understand the different types of variables, how they are used, and how to summarize the data.
-
Students mustView
- Download the PDF version of the text by clicking on the appropriate link. Then, read sections 2.1, 2.2 (pertaining to histograms only), 2.3, and 2.4 (pages 68–100). If your understanding is weak, go through the exercises.
- Understand and identify the different types of plots and graphs.
-
Students mustView
- Read section 4.3, "Univariate graphical EDA" (pages 72–88), as well as subsection 4.5.2, "Scatterplot" (pages 95–97).
- Understand and identify the different types of plots and graphs.
-
Students mustView
- Read the entire chapter (pages 9–17).
- Understand the different types of variables, how they are used, and how to summarize the data.
-
Quiz: Module 1: Lesson 2
To access the quiz, click on the name of the quiz provided above. On the following screen, click the "Preview quiz now" button to respond to the questions.
TO PASS THIS QUIZ, YOU MUST OBTAIN A SCORE OF 80%
-
Read the entire article.
-
Module 1: Lesson 3: Descriptive Statistics and Distribution
Student Learning Objectives:
Upon completion of this lesson, you will be able to:
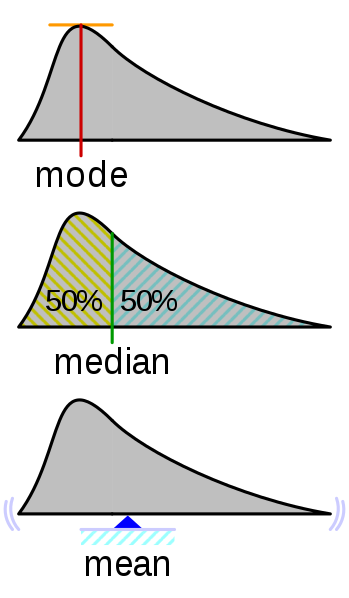
- Generate descriptive statistics from data, calculate descriptive statistics and standard deviations, and understand the methods of summarizing a single quantitative variable.
- Summarize and describe the distribution of a categorical variable, and understand the uses and implications of the normal distribution.
Approximate time required to complete the readings (at 144 words/minute) and assignments for this module: 1 hour.
Required Learning Resources and Activities
-
Students mustView
- Read section 4.2, "Univariate non-graphical EDA" (pages 63–72). Then, read part of section 4.4, "Multivariate non-graphical EDA" (from page 88 through page 90).
- Generate descriptive statistics from data, calculate descriptive statistics and standard deviations, and understand the methods of summarizing a single quantitative variable.
-
Students mustView
- Read the entire web page.
- Summarize and describe the distribution of a categorical variable and understand the uses and implications of the normal distribution.
-
Students mustView
- Click on the link “Lecture Handouts (pdf, ppt)" found on the left side of the web page. Then, under “Lecture Handouts”, click on the link “Chapter 4 Displaying, Summarizing Quantitative Data (pdf)” and read the entire handout.
- Summarize and describe the distribution of a categorical variable and understand the uses and implications of the normal distribution.
-
Students mustView
- Read down to the beginning of Example 4.5. Ignore any information relating to z-scores for now.
- Summarize and describe the distribution of a categorical variable and understand the uses and implications of the normal distribution.
-
Quiz: Module 1: Lesson 3
To access the quiz, click on the name of the quiz provided above. On the following screen, click the "Preview quiz now" button to respond to the questions.
TO PASS THIS QUIZ, YOU MUST OBTAIN A SCORE OF 80%
-
- Download the PDF version of the text by clicking on the appropriate link. Then, read sections 2.5–2.7 (pages 100–120).
-
Module 1: Lesson 4: Data Analysis and Study Design
Student Learning Objectives:
Upon completion of this lesson, you will be able to:
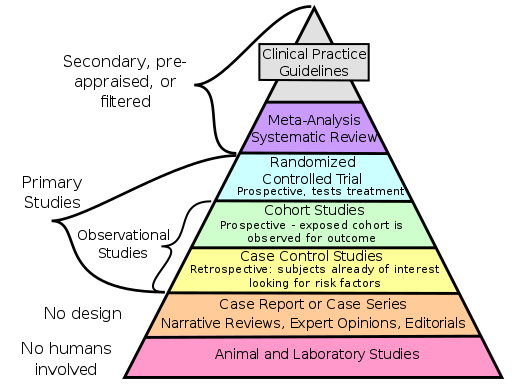
- Understand the basic types of data, the main ways in which data are used, and important considerations when using data in analysis.
- Identify the design of a study and explain how this impacts interpretation.
- Apply knowledge and skills in working with different data types in a chosen public health setting.
Approximate time required to complete the readings (at 144 words/minute) and assignments for this module: 3 hours.
Required Learning Resources and Activities
-
Students mustView
- Read all slides.
- Understand the basic types of data, the main ways in which data are used, and important considerations when using data in analysis.
-
Students mustView
- Read the entire article. It provides an overview of the entire course.
- Understand the basic types of data, the main ways in which data are used, and important considerations when using data in analysis.
-
Students mustViewWatch the entire webinar. The webinar deals with how the timely analysis and public dissemination of data being used to guide and evaluate policy and public health response to the overdose crisis in Rhode Island. (60 minutes)
-
Students mustViewReceive a grade
- Find a local public health professional, someone who works regularly with health data and produces quantitative reports on health data -- e.g., mortality and morbidity, service and administrative data, health assessments, program evaluation.
- In 500 to 700 words, answer the questions below for yourself based on your research of your mentor’s role or organization.
- Data type

- What data does your mentor work with?
- Where do these data come from? How are they collected?
- What type of variables are they?
- Data quality and manipulations
- How does your mentor ensure the data are of good quality?
- Do they encounter missing data? What would they do about missing data?
- What other data quality or validity challenges do they experience?
- Measures and metrics
- What kind of statistics does your mentor produce in their reports?
- Why would they or their organization choose to report these measures rather than others?
- What kind of visual tools (e.g., tables and graphics) does your mentor use to present their data and findings? How are these data visualization tools appropriate to the audience?
- Apply knowledge and skills in working with different data types in a chosen public health setting.
-
- Discuss the following questions with your mentor to get their perspective. (Optional: Revise your peer-reviewed assignment to include what you learned from your mentor.)
- Data type

- What data does your mentor work with?
- Where do these data come from? How are they collected?
- What type of variables are they?
- Data quality and manipulations
- How does your mentor ensure the data are of good quality?
- Do they encounter missing data? What would they do about missing data?
- What other data quality or validity challenges do they experience?
- Measures and metrics
- What kind of statistics does your mentor produce in their reports?
- Why would they or their organization choose to report these measures rather than others?
- What kind of visual tools (e.g., tables and graphics) does your mentor use to present their data and findings? How are these data visualization tools appropriate to the audience?
- Apply knowledge and skills in working with different data types in a chosen public health setting.
-
Quiz: Module 1: Lesson 4
To access the quiz, click on the name of the quiz provided above. On the following screen, click the "Preview quiz now" button to respond to the questions.
TO PASS THIS QUIZ, YOU MUST OBTAIN A SCORE OF 80%
-
- Read the entire web page.