

Section: Module 5: Regression Analysis | Biostatistics | NextGenU.org
-
Competencies covered in this module:

- Apply common statistical methods for inference.
- Apply descriptive and inferential methodologies according to the type of study design for answering a particular research question.
-
Module 5: Lesson 1: Simple Linear Regression Analysis
Student Learning Objectives:
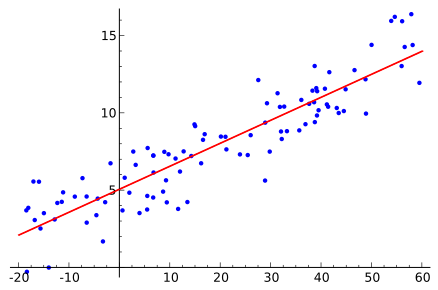
Upon completion of this lesson, you will be able to:
- Understand linear relationships, outliers, and the basics of correlation.
- Understand the difference between correlation and simple linear regression, and when to apply one or the other.
- Understand homoscedasticity and its applications to correlation and regression.
- Understand linear regression and how it relates to prediction.
Approximate time required to complete the readings (at 144 words/minute) and assignments for this module: 5 hours.
Required Learning Resources and Activities
-
Students mustView
- Download the PDF version of the text by clicking on the appropriate link. Then, in Chapter 12 titled "Linear Regression and Correlation", read the introductory section along with sections 12.1, 12.2, 12.3, and 12.6 (pages 679-691 and 697-704).
- Understand linear relationships, outliers, and the basics of correlation
-
- Read down to the beginning of the section titled "How the test works".
- Understand the difference between correlation and simple linear regression, and when to apply one or the other
-
Students mustView
- Read the web page as well as sections 1.2 and 1.3. Access sections 1.2 (What is the "Best Fitting Line"?) and 1.3 (The Simple Linear Regression Model) by clicking on the titled links found on the left side of the web page.
- Understand the difference between correlation and simple linear regression, and when to apply one or the other
-
-
Students mustView
- Read the web page as well as sections 2.1 to 2.5. Access sections 2.1 (Inference for the Population Intercept and Slope), 2.2 (Another Example of Slope Inference), 2.3 (Sums of Squares), 2.4 (Sums of Squares (continued)), and 2.5 (Analysis of Variance: The Basic Idea) by clicking on the titled links found on the left side of the web page.
- Understand the difference between correlation and simple linear regression, and when to apply one or the other
-
Students mustView
- Scroll down and read the section titled "Assumptions" to understand the definition of Homoscedasticity.
- Understand homoscedasticity, and its applications to correlation and regression
-
Students mustView
- Read the web page as well as sections 3.1 to 3.3. Access sections 3.1 (The Research Questions), 3.2 (Confidence Interval for the Mean Response), and 3.3 (Prediction Interval for a New Response) by clicking on the titled links found on the left side of the web page.
- Understand linear regression and how it relates to prediction
-
Students mustView
- Read the web page as well as sections 4.1 to 4.8. Access sections 4.1 (Background), 4.2 (Residuals vs. Fits Plot), 4.3 (Residuals vs. Predictor Plot), 4.4 (Identifying Specific Problems Using Residual Plots), 4.5 (Residuals vs. Order Plot), 4.6 (Normal Probability Plot of Residuals), 4.7 (Assessing Linearity by Visual Inspection), and 4.8 (Further Examples) by clicking on the titled links found on the left side of the web page.
- Understand linear regression and how it relates to prediction
-
Quiz: Module 5: Lesson 1
To access the quiz, click on the name of the quiz provided above. On the following screen, click the "Preview quiz now" button to respond to the questions.
TO PASS THIS QUIZ, YOU MUST OBTAIN A SCORE OF 80%
-
- Read the entire article.
-
- Download the PDF version of the text by clicking on the appropriate link. Then, read sections 12.4 and 12.5 titled "Testing the Significance of the Correlation Coefficient" and "Prediction" respectively (pages 691-697).
-
Module 5: Lesson 2: Multiple Linear Regression Analysis
Student Learning Objectives:
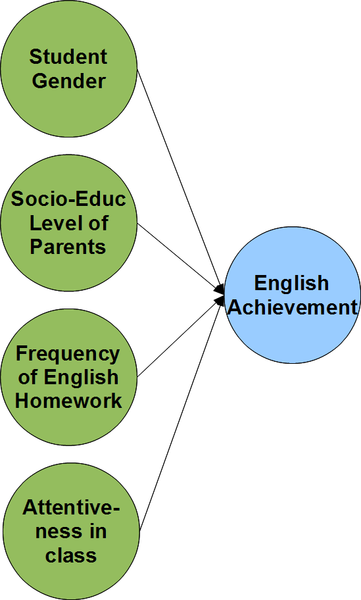
Upon completion of this lesson, you will be able to:
- Understand multiple linear regression and its applications.
Approximate time required to complete the readings (at 144 words/minute) and assignments for this module: 1 hour.
Required Learning Resources and Activities
-
Students mustView
- Scroll down to the heading titled "Module 2: Linear Regression", and click on the PDF links to parts A to E of Lecture 5 (Relating a Continuous Outcome to More than One Predictor: Multiple Linear Regression). Read the slides. An audio recording of the presentation is also available.
- Understand multiple linear regression and its applications
-
Students mustView
- Read the web page as well as sections 5.1 to 5.3. Access sections 5.1 (Example on IQ and Physical Characteristics), 5.2 (Example on Underground Air Quality), and 5.3 (The Multiple Linear Regression Model) by clicking on the titled links found on the left side of the web page.
- Understand multiple linear regression and its applications
-
Quiz: Module 5: Lesson 2
To access the quiz, click on the name of the quiz provided above. On the following screen, click the "Preview quiz now" button to respond to the questions.
TO PASS THIS QUIZ, YOU MUST OBTAIN A SCORE OF 80%
-
Module 5: Lesson 3: Logistic Regression Analysis
Student Learning Objectives:
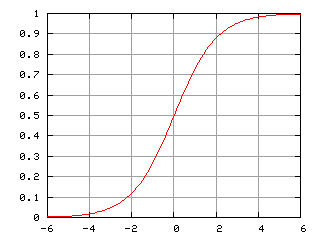
Upon completion of this lesson, you will be able to:
- Understand simple logistic regression analysis.
- Understand multiple logistic regression analysis and distinguish between adjusted and unadjusted regression coefficients.
- Be able (1) to distinguish between risks, e.g., absolute and relative risks, as well as odds and odds ratios, and (2) to differentiate relative risks from odds ratios and know how to conduct both methods.
Approximate time required to complete the readings (at 144 words/minute) and assignments for this module: 4 hours.
Required Learning Resources and Activities
-
-
-
Students mustView
- Read the web page (section 15.1) as well as sections 15.2 to 15.3. Access sections 15.2 (Polytomous Regression) and 15.3 (Further Logistic Regression Examples) by clicking on the titled links found on the left side of the web page.
- Understand multiple logistic regression analysis and distinguish between adjusted and unadjusted regression coefficients
-
Students mustView
- Read the entire article.
- Be able (1) to distinguish between risks, absolute and relative risks, as well as odds and odds ratios, and (2) to differentiate relative risks from odds ratios and know how to conduct both methods
-
Students mustView
- Read the entire article.
- Be able (1) to distinguish between risks, absolute and relative risks, as well as odds and odds ratios, and (2) to differentiate relative risks from odds ratios and know how to conduct both methods
-
Students mustView
- Read the entire web page.
- Be able (1) to distinguish between risks, absolute and relative risks, as well as odds and odds ratios, and (2) to differentiate relative risks from odds ratios and know how to conduct both methods
-
Quiz: Module 5: Lesson 3
To access the quiz, click on the name of the quiz provided above. On the following screen, click the "Preview quiz now" button to respond to the questions.
TO PASS THIS QUIZ, YOU MUST OBTAIN A SCORE OF 80%
-
- Read the entire article.
-
- Read the web page (section 15.4) as well as sections 15.5 to 15.8. Access sections 15.5 (Generalized Linear Models), 15.5 (Nonlinear Regression), 15.7 (Exponential Regression Example), and 15.8 (Population Growth Example) by clicking on the titled links found on the left side of the web page.
-
Module 5: Lesson 4: Overview of Correlation and Regression Analysis
Student Learning Objectives:
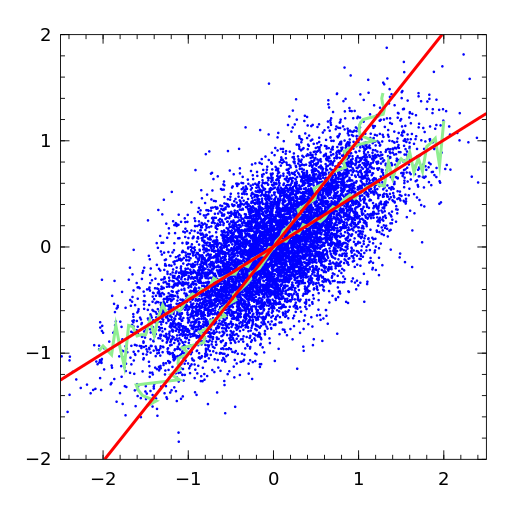
Upon completion of this lesson, you will be able to:
- Be able (1) to distinguish between correlation, linear and multiple regression, and logistic regression, and (2) to understand the purpose and methods of linear (simple and multiple) and logistic regression, including when to use each of them.
- Be able to specify regression models and interpret regression results.
Approximate time required to complete the readings (at 144 words/minute) and assignments for this module: 1 hour.
Required Learning Resources and Activities
-
Students mustView
- Read the entire article.
- Be able (1) to distinguish between correlation, linear and multiple regression, as well as logistic regression, and (2) to understand the purpose and methods of linear (simple and multiple) and logistic regression including when to use each of them
-
Students mustViewReceive a grade
- The fitted equation from a study on infant head circumference is as follows:
head circumference = 1.76 + 0.86×gestational age - 2.82×toxemia
+ 0.046×(gestational age×toxemia)
where gestational age is measured in weeks and toxemia is an indicator variable for the mother’s toxemia status during pregnancy (1=had toxemia).
- For infants whose mothers did not have toxemia during pregnancy, what is the effect of an extra two weeks of gestation? What about for those whose mothers had toxemia?
- What other information or calculations would you need to decide whether to include this effect in the final model?
- What effect does the last term represent? How would you interpret this effect?
- Be able to specify regression models and interpret regression results
-
Students mustViewReceive a grade
- Consider the following hypothetical scenario: Two experimental treatments (A and B) are administered to patients having just suffered a stroke. After a few months, the following data is obtained (Table 1). A multivariate logistic regression model is later constructed from this data (Table 2). Answer questions 1-9 based on this information.
Table 1: Effect of treatment on stroke survival by smoking statusPatients
Treatment A
Treatment B
Total
Non-smokers
No. of deaths
46
8
54
No. of survivors
105
37
142
Total
151
45
196
Smokers
No. of deaths
105
15
120
No. of survivors
160
81
241
Total
265
96
361
Table 2: Results from a multivariate logistic regression based on data from Table 1 (Reference group = non-smokers, treatment B)Parameter
Fitted value of β
Intercept
(Ref. group: non-smoker, treatment B)β0 = -1.856
Smoking status
β1 = 0.314
Treatment option
β2 = 1.090
Questions- From Table 1, calculate the odds ratio of death for non-smokers under treatment A .
- From Table 1, calculate the odds ratio of death for smokers under treatment B.
- Explain in words what these odds ratios mean.
- From Table 2, write the corresponding multivariate logistic regression equation. Indicate what the variables mean and which values they can take.
- Calculate the odds of death and the probability of death for non-smokers under treatment B.
- Calculate the odds of death and the probability of death for smokers under treatment B.
- Calculate the odds of death and the probability of death for non-smokers under treatment A.
- Calculate the odds of death and the probability of death for smokers under treatment A.
- What is the sum of all the probabilities?
- Be able to specify regression models and interpret regression results
-
Quiz: Module 5: Lesson 4
To access the quiz, click on the name of the quiz provided above. On the following screen, click the "Preview quiz now" button to respond to the questions.
TO PASS THIS QUIZ, YOU MUST OBTAIN A SCORE OF 80%
-
- Read the entire article.
-
Answer key. Linear regression problem 1 File17.9 KB
-
Answer key. Linear regression problem 2 File28.9 KB